


Gold and Stock Market Trading Surrounded by European Sovereign Debt Crisis Risk
Stock-Markets / Financial Markets 2011 Nov 21, 2011 - 10:57 AM GMTBy: J_W_Jones

 The current trading environment is one of the most difficult that I can recall in recent memory. Risks abroad regarding the European sovereign debt crisis is keeping market participants on edge as headline risk seemingly surrounds traders at every turn.
In addition to the risk posed by Europe, the market’s reaction to the Congressional Super Committee’s upcoming statements also poses risks. As it stands now, the media is reporting that the committee is in gridlock and has yet to compromise. The deadline for the Super Committee is Wednesday, November 23rd. The gridlock leads to uncertainty, and Mr. Market hates uncertainty. High levels of uncertainty corresponds with increased volatility levels, thus caution is warranted.
Recently I have been actively trading around the wild price action, but I have been utilizing smaller position sizes in light of the elevated volatility levels. In addition to the smaller position sizes, I have been aggressively taking profits and moving stops in order to protect trading capital.
This past week, members of my service enjoyed two winning trades. We were able to lock in gains on a SPY Put Calendar Spread for a nice 20% gross gain. On Friday we closed a USO Put Calendar Spread for a gross gain of 17%. These trades were relatively short term in duration, but the gains they produced were strong.
Both trades took advantage of increased volatility which resulted in enhanced profits. If volatility remains elevated going forward which I expect, these types of trades will offer great risk / reward going forward. Volatility is an option traders friend, and this past week members of my service were able to lock in some strong gains with relatively muted levels of risk.
Gold Futures
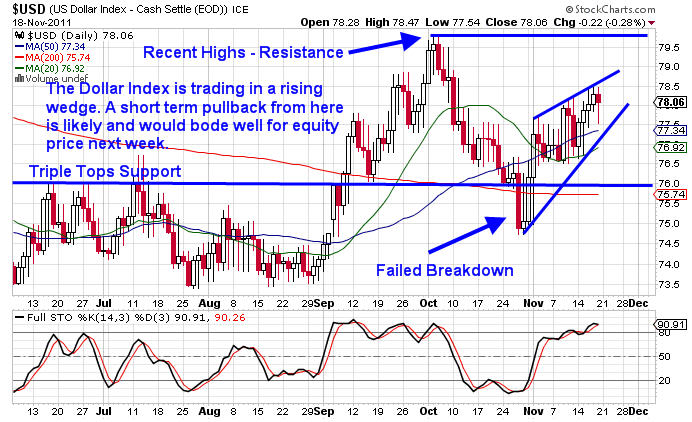
I have not written much about gold recently as I have honestly not seen a great deal of opportunity in either direction there. The price action has been quite volatile, but this past week we saw gold futures sell off sharply. I believe the explanation for the selloff is partially due to strength in the U.S. Dollar. The daily chart of the U.S. Dollar Index is shown below:
The recent selloff in gold can likely be attached to the increase in margin calls around the world as a likely consequence of the MF Global bankruptcy. Uncertainty surrounds the commodities market as the collapse of MF Global has interrupted traditional capital flows and broad based volume around the world. The MF Global situation continues to provide a negative headwind for financial markets in general.
I continue to be a long term bull regarding precious metals as nearly every central bank is either printing money deliberately or is increasing the money supply through quantitative easing. With multiple calls coming out of Europe over the weekend for the European Central Bank to print money to monetize European sovereign debt, it may not be long before the ECB begins their own quantitative easing program. In the long term this can only mean higher prices for gold.
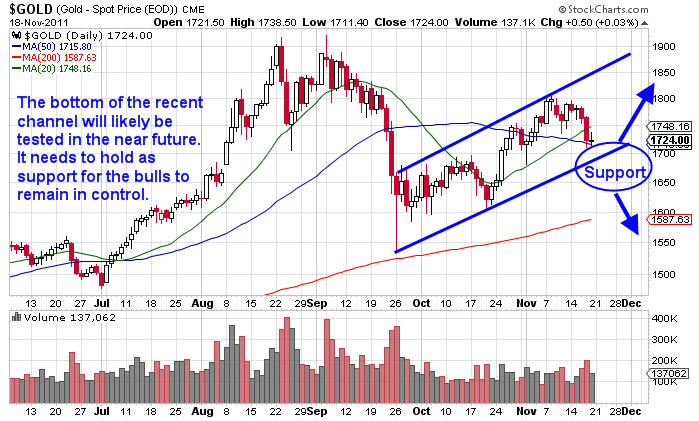
Right now the short term looks bearish for gold as the daily chart of gold futures shows gold tested near the top of a recent rising channel and failed. The selloff was strong, but a pullback here makes sense from a technical perspective. The daily chart of gold is shown below:
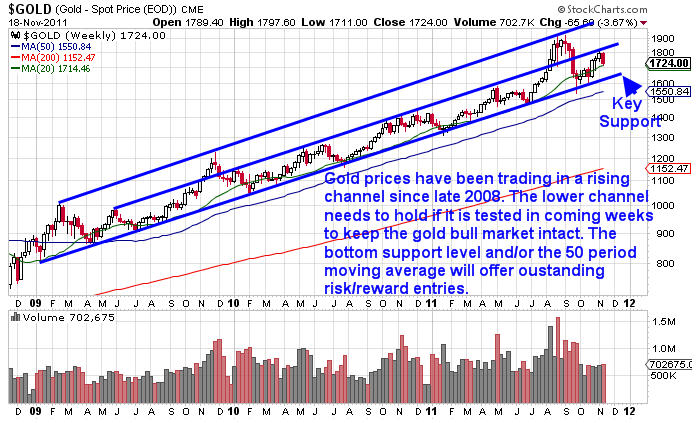
The longer term time frame continues to remain technically positive for the yellow metal. As long as gold prices hold in their multi-year rising channel, higher prices remain likely. Right now the $1,500/ounce price level needs to hold as support if the bulls are going to remain in control in the long term time frame. The weekly chart of gold futures shown below illustrates the long term rising channel:
Right now we are in a seasonally strong period for gold. I am going to be watching closely in coming weeks for a solid entry point to get long the yellow metal for a longer term time frame. Right now the short term remains bearish, but the longer term is bullish from technical and fundamental viewpoints.
S&P 500
The S&P 500 Index sold off sharply during the past week. In my most recent article, I discussed two key price levels to monitor to the downside. The key support levels were the 1,230 and 1,190 price levels respectively. The bulls need the 1,190 area to hold as support to give them any chance for a “Santa Claus Rally” into year end.
Last week the S&P 500 Index closed below the 1,230 support level meaning the 1,190 area has to hold. Otherwise, we could see a sharp selloff into the end of the year. The daily chart of the S&P 500 below illustrates the key support levels:
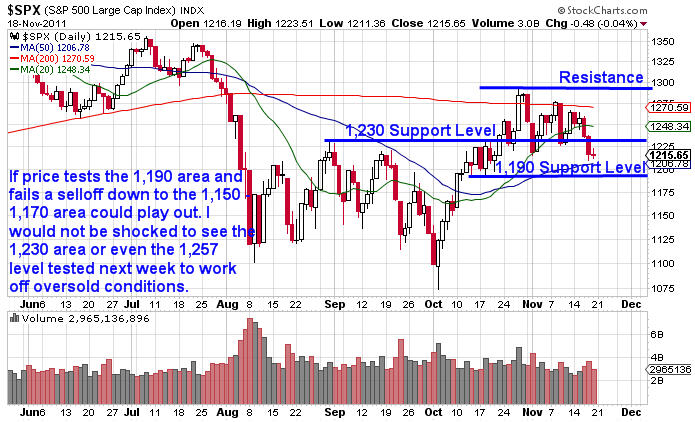
The S&P 500 looks vulnerable to the downside presently. However, headlines coming out of Europe and/or the Super Committee this week could push prices higher. The key pivot line remains around the 1,257 price level on the daily chart. If the bulls can regain the 1,257 price level on a weekly close a test of 1,290 will become more likely. However, as long as prices remain below 1,230 and 1,257, the S&P 500 is vulnerable to additional downside.
I would not be shocked to see the S&P 500 push higher this week to work off short term oversold conditions. Truncated weeks result in lower than average volume which generally favors the bulls. However, in this environment anything could seemingly happen. Risk is high in either direction.
Get My Trade Ideas Here: http://www.optionstradingsignals.com/profitable-options-solutions.php
J.W. Jones is an independent options trader using multiple forms of analysis to guide his option trading strategies. Jones has an extensive background in portfolio analysis and analytics as well as risk analysis. J.W. strives to reach traders that are missing opportunities trading options and commits to writing content which is not only educational, but entertaining as well. Regular readers will develop the knowledge and skills to trade options competently over time. Jones focuses on writing spreads in situations where risk is clearly defined and high potential returns can be realized.
This article is intended solely for information purposes. The opinions are those of the author only. Please conduct further research and consult your financial advisor before making any investment/trading decision. No responsibility can be accepted for losses that may result as a consequence of trading on the basis of this analysis.
© 2005-2022 http://www.MarketOracle.co.uk - The Market Oracle is a FREE Daily Financial Markets Analysis & Forecasting online publication.