


Stock Market Still Consolidating?
Stock-Markets / Stock Markets 2011 Nov 21, 2011 - 01:52 AM GMTBy: Andre_Gratian

 SPX: Very Long-term trend - The very-long-term cycles are down and, if they make their lows when expected, there will be another steep and prolonged decline (which appears to have already started) into 2014.
SPX: Intermediate trend - The rally from 1075 is most likely expanding its consolidation. It's probably too early to start another major leg down.
Analysis of the short-term trend is done on a daily basis with the help of hourly charts. It is an important adjunct to the analysis of daily and weekly charts which discusses the course of longer market trends.
Market Overview
Instead of breaking out on the upside of what appeared to be a triangle formation, last week the correction evolved into another pattern as the SPX plunged sixty points to re-test its major support level in the low 1200s. Elliott wave theorists were quick to call for the beginning of wave 3 and much lower prices, but this may be premature.
Surely, a little technical damage has been done, with the XLF (financial index) retracing more than 50% of its rally from October 4, and this caused the SPX to retrace .382 of the rally, but neither the DJIA nor the RUT were as weak, putting into question what this decline represents.
There are other (even more important) signs of non-confirmation, such as the performance of the VIX, TLT and the dollar, all contrary indicators which are looking more likely to roll-over than go up. We will need a little more time to decipher what the market is doing and, by next week, we should have a much better idea of its intentions.
For now, it looks as if a little more weakness on Monday morning could finish off this phase, and be followed by a rally. The nature of this rally should tell us whether or not the Elliott analysts are correct.
As of Friday's close, all intra-day trends and the daily trend were down, but the weekly trend remained up, with the indices looking as if they were trying to put in a near-term low. Monday should be an important day which could decide the fate of the market over the short term.
Chart analysis
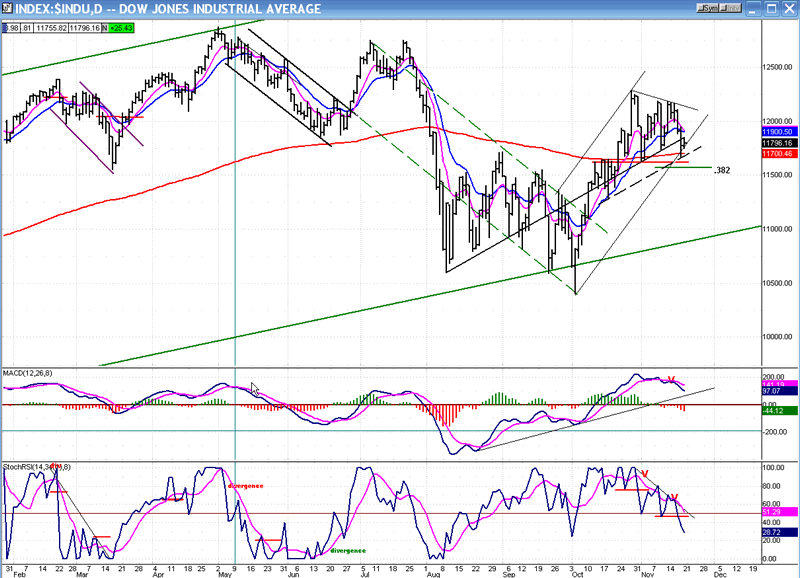
For the Daily Chart, I am going to show you the chart of the DJIA, because it may be a little more representative of the overall market. Last week's decline does not look like such a big deal on this chart, only like an extension of the correction pattern. The indicators have given a sell signal and will have to turn up before an uptrend can resume, and this is likely to take more than one attempt at going up. For now, the Dow has found support on its 200-DMA and at the top of a former small congestion level which has supported it before.
It has also stopped on the bottom line of an interim channel which is drawn by connecting two previous tops and drawing a parallel to that line from the low of the move. I would not bet the bank on that trend line holding, but it may be enough, in conjunction with the other supports, to arrest the decline for now.
I want to call your attention to some other interesting features on this chart. Note how the extension of the initial downtrend line from the top (green dashed line) brought support to the last two lows of the of the October correction. Also interesting, drawing a parallel to that extension from the secondary top formed a perfect channel for the last phase of the decline. More often than not, parallels to trend lines are very helpful in determining support and resistance. For instance look how the small (dashed) parallel to the internal trend line connecting several lows (drawn from the 10/18 low) provided support for prices on Thursday and arrested the decline.
For the Hourly Chart analysis, we'll use the SPX. I'll start by saying that I probably got my short-term cycles mixed-up, and that the 13-wk cycle was supposed to bottom in this time frame, and not a week ago. It makes a lot more sense. It also explains why there is some non-confirmation in the VIX and UUP. If the cycle turns up next week, the market should go up with it and the contrary indices should go down. They may already be anticipating a rally.
On top of the bottoming cycle, the top of the P&F target of 1210-1206 has also been reached, and if we have one more little wave down on Monday morning (to complete a 5-wave pattern), we could reach 1206 and then have a good rally. Should this rally fail to exhibit some strength, we would then be susceptible to dropping down to the next count of 1186.
The same channel support pointed out on the DJIA daily chart is shown here in green trend lines. There is also support from the former low (red horizontal line), and the mid-channel (dashed) trend line of the larger dark-blue channel. This is expected to be the main channel of the intermediate trend which started on October 4th. It should keep prices in an uptrend until it is violated.
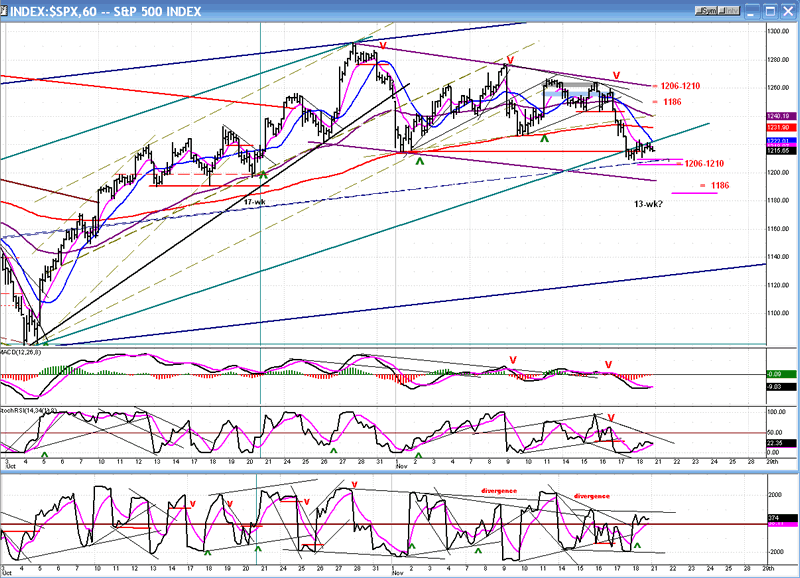
The two top momentum indicators are telling us that the decline may still have a little more work to do before ending, but the lower A/D indicator is showing much more strength, thus signaling that the reversal is probably just a few hours away.
Cycles
From last week: "The 13-wk cycle is due on Monday or Tuesday." This was most likely the wrong time frame which was off by a week! The rest of last week's statement still stands: "Afterwards, there are, to my knowledge, no significant cycles due to bottom until late December."
Breadth
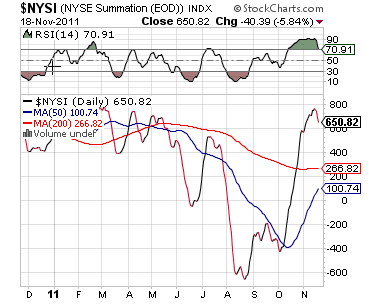
The NYSE Summation Index (courtesy of StockCharts.com) has barely acknowledged last week's decline. As a result, the RSI is still very overbought and it is likely that we will need to extend the correction before attempting to go up again.
If the Summation Index holds up well during the RSI correction, we should be able to attract more buyers, and perhaps rally to new highs.
Sentiment
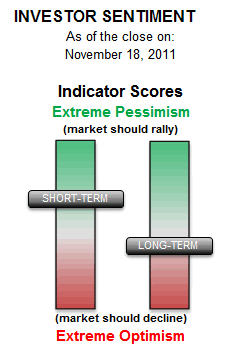
The SentimenTrader (courtesy of same) is confirming the oversold condition of the market. The short-term indicator has moved into the green. This adds to the possibility of a near-term rally.
The VIX
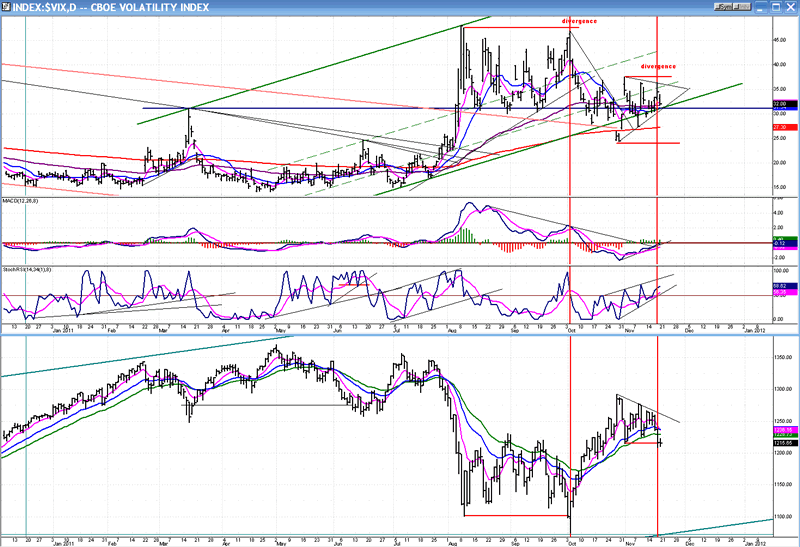
Let's compare the action of the SPX (bottom) to the VIX (top) to see if we can derive some clues about the future action of the market.
They are inverse images of each other and, as long as that relationship is exact, the trend in the SPX should continue in the same direction. If, however, the VIX begins to deviate, it could mean that it is about to reverse its direction, and so should the SPX.
The VIX shot up in early August, as the SPX was beginning to tank. Both indices temporarily ended their trends and went into a long consolidation pattern which ended with the SPX making a new low.
Accordingly, the VIX went in the opposite direction, but it failed to make a new high, and that was an indication that the SPX was about to reverse its trend from down to up. This warning was followed by a vigorous 217-point rally. As the SPX rallied, the VIX declined, both going into inverse triangular consolidation patterns.
On Thursday, the SPX made a new correction low, but the VIX did not make a new high! And on Friday, as the SPX went sideways, the VIX declined! It looks as if the pattern which took place in early October is about to repeat itself. That would mean that the VIX should continue to decline while the SPX starts to rally. If that happens, and subsequently the VIX breaks below its short-term and intermediate trend lines, it would probably mean that the SPX has ended its decline and should continue the rally which it started at 1075.
We are not there, yet, but the action of both indices in relationship to each other bears watching over the next couple of weeks.
THE DOLLAR INDEX (UUP)
UUP is making an interesting (weak) pattern which may have a profound effect on the equity market over the next few weeks.
The index has been in a long-term down channel since 6/10, and it does not seem in a big hurry to get out of it. The low that it made in May -- which was successfully re-tested in August -- is a higher low than the one made in 2008. Nevertheless, while a higher long-term low suggests that it should be ready to enter into a significant uptrend, it does not seem to be able to develop the necessary momentum.
After its second low, it briefly managed to rise above its 200-DMA, but could not even get to the top of its channel and, after retracing almost all the way to the low, it is making another feeble attempt. On its first rally, the index almost managed a .382 retracement of its one year downtrend, but could go no further and fell back heavily. The second attempt was even weaker! It barely got above the .236 retracement level, while making a bearish rising wedge, a pattern which, when broken to the downside, often retraces to the start of the move.

Since the first rise to 22.62 looks like an impulse wave, it's possible that UUP is ready to embark on the "c" wave of an a-b-c correction. Assuming that "c" takes as long as "a", which took one month, this gives plenty of time for the equity market to stabilize, start a new uptrend, and perhaps even make a new rally high.
After that, UUP would have established a substantial base, and should be ready to start on wave 3 and break out of its channel. By then, the SPX would have completed its "C" wave also, and would be ready to come down hard; this time perhaps as the "wave 3" EW analysts believe has already started. Lots of maybes, but logical nonetheless! Let's see how it plays out.
A look at oil
Oil has been surging for the past few weeks. Can it continue? Let's take look at the daily chart of USO, one of the oil ETFs. It is representative (on a smaller scale) of what crude is doing.
In February 2000, USO made a low at 22.74 and started to rise in concert with the bull market which started shortly afterward. In April 2010, it encountered the (red) downtrend line from its October high of 119.17, and corrected. It continued its advance to a recovery high of 46, then fell back with the market correction that started in May 2011 to a low of 29.71, from which it began the current advance to almost 40.
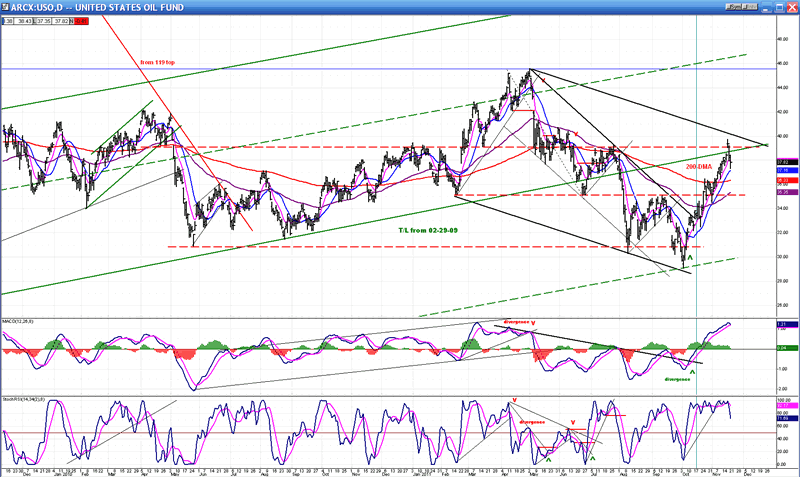
That's the history. Now let's draw some trend lines and channels so that we can really see what it is doing.
The red line represents the long-term downtrend line from its 2007 peak. The solid green lines delineate the rising channel that has been formed since the 2009 low. The top (green) dashed line is the mid-point of that channel, and another parallel dashed line is drawn across the 29.70 low.
When USO broke down and out of its green channel, it dropped approximately the equivalent of another half channel width before finding support. It also reached its downside Point & Figure projection of 30. This is where the current relentless and steep uptrend started, but it has now reached important resistance.
First, it is back-testing the lower trend line of the green channel. That in itself should push it back into a consolidation, if not a complete reversal. On top of that, it has reached the top of the black descending channel, which should also be resistance. Finally, the horizontal red dashed line is a level which has provided both support and resistance to the price as far back as you can see.
And, as if that were not enough, 39 is also a phase count of the base that was created between August and October. There is very little question in my mind that the index is due for some consolidation before moving higher. The indicators - especially the MSO - show that it has already started.
But that will not necessarily be the end of its run! The P&F base has a total count of 44. So, structurally, this is probably the "a" wave of an a-b-c corrective pattern. The "b" will be the much needed consolidation, and it will be followed by a "c" wave to 44 to fill the P&F projection, complete the structure, and be ready to resume the intermediate downtrend which started at 45.60
Summary
As a result of last week's decline, and as of Friday's close, all intra-day trends are down and the daily trend is down as well. The only one that still remains up is the weekly trend which, so far, is only correcting. Most indices have retraced .382 or less of their rally from early October.
Based on the market action, we cannot yet assume that a bear market decline has resumed or, to put it in EW lingo, that we are witnessing the beginning of "wave 3"! We can only say that the correction, which now consists of a failed triangle pattern, is continuing.
As pointed out on the SPX hourly chart, the recent distribution top has produced projections to 1210-1206, which were reached on Thursday. There is another very real possibility that, after we get a rally from this level, we will continue the decline to the next potential target of 1186. That should be the downside risk for the near-term. Should the decline continue beyond 1186, then we would be looking at downside targets to 1096 and 1071.
FREE TRIAL SUBSCRIPTON
If precision in market timing for all time frames is something which is important to you, you should consider a trial subscription to my service. It is free, and you will have four weeks to evaluate its worth.
For a FREE 4-week trial. Send an email to: ajg@cybertrails.com
For further subscription options, payment plans, and for important general information, I encourage you to visit my website at www.marketurningpoints.com. It contains summaries of my background, my investment and trading strategies and my unique method of intra-day communication with Market Turning Points subscribers.
By Andre Gratian
MarketTurningPoints.com
A market advisory service should be evaluated on the basis of its forecasting accuracy and cost. At $25.00 per month, this service is probably the best all-around value. Two areas of analysis that are unmatched anywhere else -- cycles (from 2.5-wk to 18-years and longer) and accurate, coordinated Point & Figure and Fibonacci projections -- are combined with other methodologies to bring you weekly reports and frequent daily updates.
“By the Law of Periodical Repetition, everything which has happened once must happen again, and again, and again -- and not capriciously, but at regular periods, and each thing in its own period, not another’s, and each obeying its own law … The same Nature which delights in periodical repetition in the sky is the Nature which orders the affairs of the earth. Let us not underrate the value of that hint.” -- Mark Twain
You may also want to visit the Market Turning Points website to familiarize yourself with my philosophy and strategy.www.marketurningpoints.com
Disclaimer - The above comments about the financial markets are based purely on what I consider to be sound technical analysis principles uncompromised by fundamental considerations. They represent my own opinion and are not meant to be construed as trading or investment advice, but are offered as an analytical point of view which might be of interest to those who follow stock market cycles and technical analysis.
Andre Gratian Archive |
© 2005-2022 http://www.MarketOracle.co.uk - The Market Oracle is a FREE Daily Financial Markets Analysis & Forecasting online publication.