


On the Verge of Huge Stock Market Crash, Implications For Gold and Silver
Stock-Markets / Financial Crash Nov 20, 2011 - 03:36 PM GMTBy: Willem_Weytjens

 We might be on the verge of another huge market crash, one similar to 2008.
Check out the following chart below, and you will see why…
- The RSI hasn’t been overbought anymore in a long time, indicating weakness in stock markets… The same was true in 2008.
- The SP500 found heavy resistance in the 1260-1280 zone (just as we warned our subscribers), which was the low of June 2011. A similar thing happened back in May 2008, where price ran into resistance of the November 2007 low.
- Look at the exponential moving averages (20, 50, 100 and 200 EMA’s). They have now been converging as price rallied, but right now, price is falling below these EMA’s, just like in late May 2008.
- The MACD is now flirting to break the green support line, just like in May 2008, right before financial armageddon occured, and price is right at the green support line now, just like in 2008.
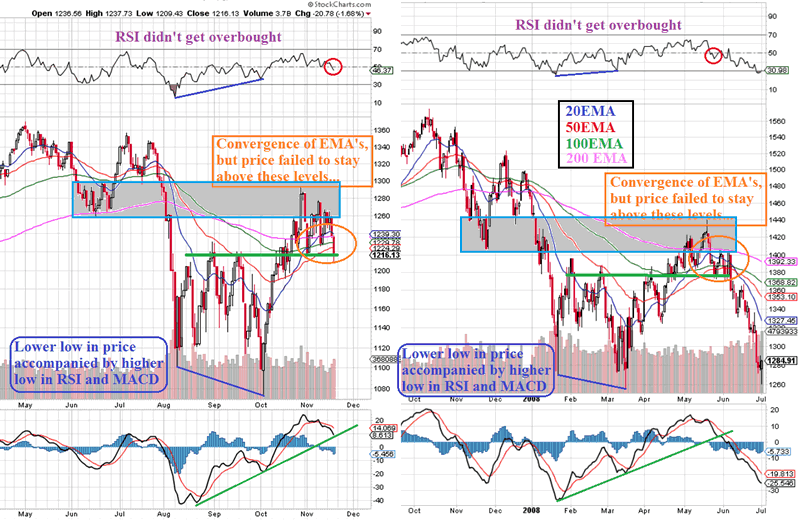
Chart courtesy stockcharts.com
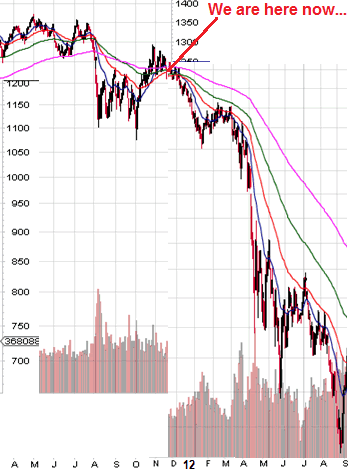
If we are about to see the exact move as in 2008, this is what it would look like…
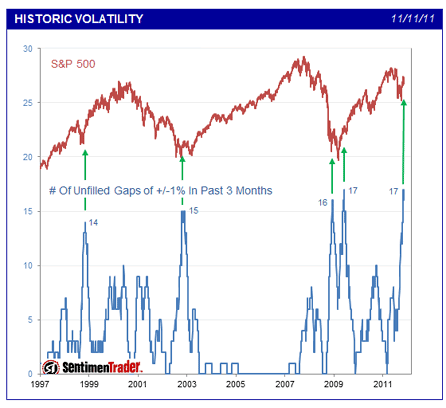
However, Charles Schwab and Sentimentrader noted: “On Friday 11th of November, the market experienced the 17th time in the past three months that the S&P 500 SPY (exchange-traded fund trading the S&P 500) gapped by more than 1% at the open and then didn’t close that gap during the day. This means that the S&P didn’t reverse enough to “kiss” the previous day’s close. As you can see in the chart below, this level of “unclosed gap” behavior has been seen only four other times since the early-1990s. All occurred while the market was forming a major bottom.”
So on the one hand, we might see a crash. On the other hand, there is just so much negativity out there, that one should ask him/herself if it’s not time to buy???
Just ASSUME we are going to see another crash like in 2008… What would likely happen to the different asset classes in such a scenario?
1) the USD seems to have broken out to the upside. This is usually bad news for stock markets.
2) Gold is still “safe”, as it is still above the 150EMA, a level that has proven to be strong support during this entire bull market, with a minor exception in 2008.
3) GDX, a gold mining ETF, is still “safe”, as price is still holding above the 400EMA, a level that has proven to be strong support during this entire bull market, with one exception in 2008.
4) Silver has fallen below the 250EMA, a level that has proven to be strong support during this entire bull market, with one exception in 2008.
5) the SP500 is now in a dangerous situation, as price is now below the 250EMA, just like in 2008…
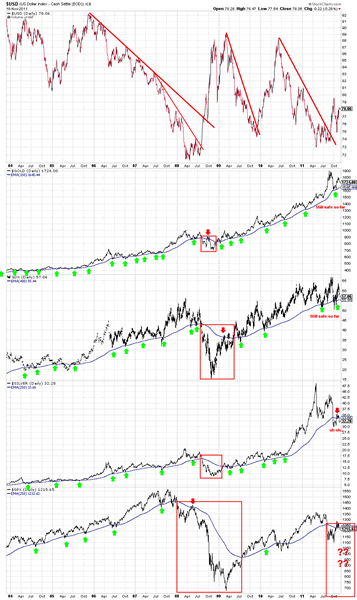
Chart: stockcharts.com
If the stock market would be headed for a remake of 2008, one would expect similar implications for Gold, Silver and the Mining stocks…
They would all crash, as investors look for “safety” (the USD and US Government Bonds).
This is the most likely scenario.
However, it's not necessarily the case this time. Back in 2008, the yields on 10 year bonds was as high as 4%. Right now, 10 year bonds only yield 2%. That’s a big difference between bonds in 2008 and 2011… Another big difference between then and now, is the amount of debt that exists. After the financial crisis of 2008, the debt level of the USA has become “unsustainable” and “unmanageable”. Would you trust your money to the US during 10 years, for only 2% interest? No thanks.
If (when) the credit rating of the US is lowered, I think that would be the time when the “flight to gold” would occur. Gold would then be seen as the only “safe haven” out there.
Another difference between 2008 and now regarding commodities, is the fact that sentiment is now completely different from 2007-2008.
Back in 2008, commodities were at all-time highs, but so was sentiment, as we can see in the following chart:
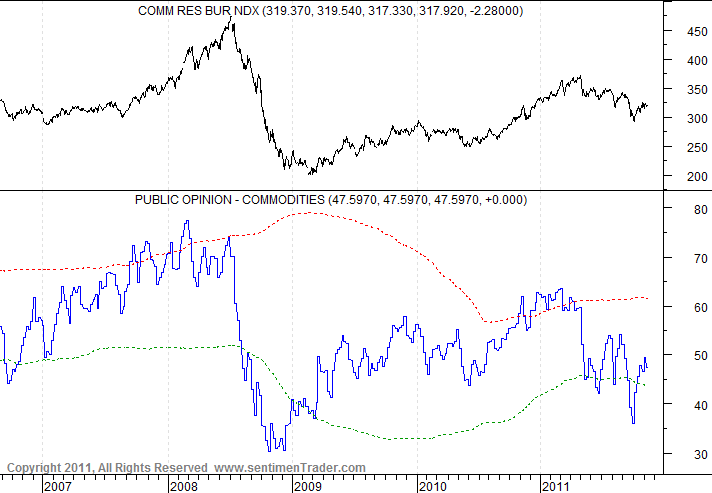
Chart: sentimentrader.com
Right now, sentiment for the CRB index is not bullish nor bearish.
The same is true for sentiment for Gold:
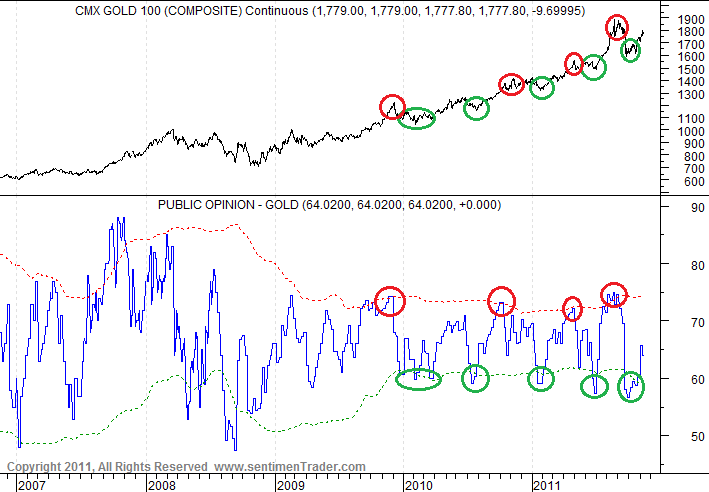
Chart: sentimentrader.com
Look at the green and red circles in the chart above. When you buy in times when sentiment is bearish (green circles) and sell in times when sentiment is bullish (red circles), you get incredibly good entry and exit points for gold.
Sentiment for silver is now pretty bearish:
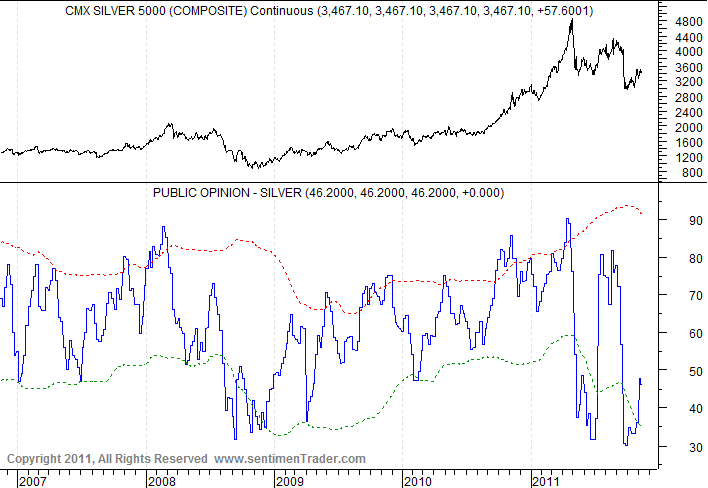
Chart: sentimentrader.com
At the end of April, when silver was boiling hot, we warned our readers for the coming collapse in silver prices.. (click HERE to read the article)
In fact, we posted this chart below, which shows us the Gold-to-Silver ratio. It divides the price of one ounce of gold by the price of one ounce of silver. A rising ratio means gold outperforms silver, while a falling ratio means silver is outperforming gold.
Do you get why we left silver for what it was, and why we preferred Gold over Silver when we posted this chart?
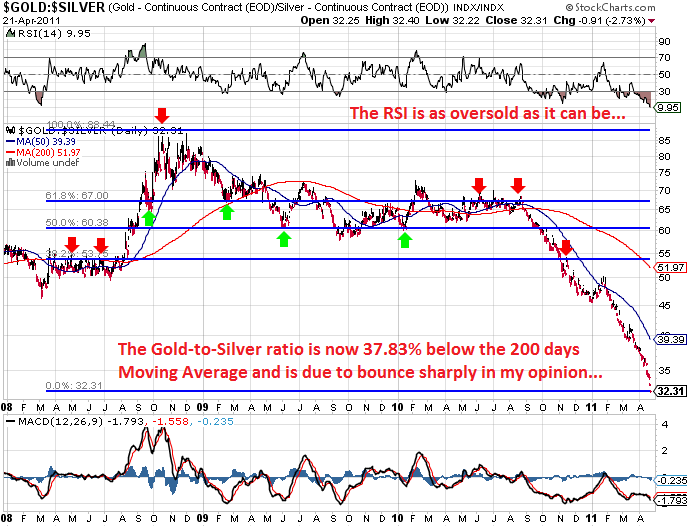
Chart: stockcharts.com
Now here is an updated version of this chart. We can clearly see that price (“the Ratio”) has found resistance at the 53 level, which is exactly the 38.2% Fibonacci Level. Whether this level will be broken remains to be seen, but more often than not, price tends to revert to the 50% level, which, in this case would be a Gold-to-Silver ratio of 60. If we are about to see 2008 again, it could even retrace all the way to the 100% level.
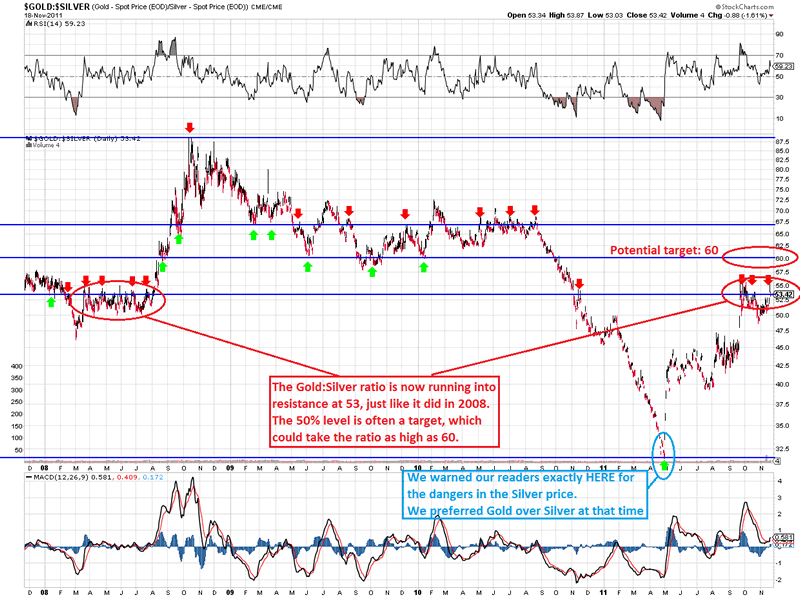
Chart: stockcharts.com
Anyway, while we preferred Gold over Silver back in April 2011, we now start to like silver again (with a focus on start to)… We still like gold, BUT when the final phase of this precious metals Bull market takes place, I think the best place to be is silver.
Silver and gold are highly correlated. When gold goes up, silver goes up, and when gold goes down, silver tends to go down. However, the price movements in Silver are much more volatile than those in gold… If gold would go as high as $5,000 (or even as high as $6,600 as I think it might go), one can imagine what will happen with the price of Silver in that case…
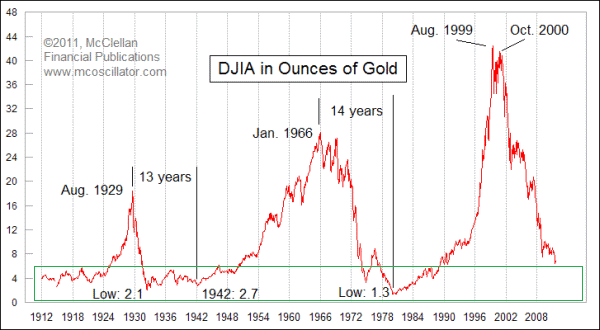
According to this chart from mcoscillator.com, we can see that Gold should outperform the equity markets for another 1-3 years.
This chart shows how many ounces of gold it takes to buy “1 share” of the Dow Jones Index. In the early 30′s, it took 2.1 ounces of gold, and in 1980, it took only 1.3 ounces of gold. Are we headed for a similar level over the next 1-3 years? Time will tell, but if you would like to have a helping hand, feel free to subscribe to our services, and get access to similar analyses, nightly updates and trading updates (we invest real capital in stocks we analyze)...
For more analyses and trading updates, please visit www.profitimes.com
Willem Weytjens
www.profitimes.com
© 2011 Copyright Willem Weytjens - All Rights Reserved
Disclaimer: The above is a matter of opinion provided for general information purposes only and is not intended as investment advice. Information and analysis above are derived from sources and utilising methods believed to be reliable, but we cannot accept responsibility for any losses you may incur as a result of this analysis. Individuals should consult with their personal financial advisors.
© 2005-2022 http://www.MarketOracle.co.uk - The Market Oracle is a FREE Daily Financial Markets Analysis & Forecasting online publication.