Stock Market Chart Patterns Beauty Of Symmetry
Stock-Markets / Stock Markets 2011 Nov 20, 2011 - 03:22 PM GMTBy: Tony_Pallotta
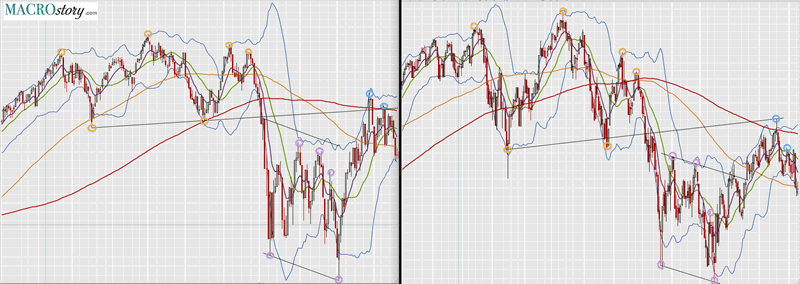
There are no other words to describe the symmetry between these two chart patterns than simply beautiful.
I purposely left the scale and dates off the charts as to not distract your eyes. It is simply too powerful to ignore yet that is what many have done, self included over the past two weeks as the 200MA blurred our vision. A somewhat meaningless number took our eyes off the pattern playing out before us.
Again as to not distract your eyes I color coded three distinct phases (phase 1 in orange, phase 2 in purple and phase 3 in blue). Notice the symmetry once again. But to me what is most powerful at this very moment is the position of the last few candles and the moving averages.
Notice the big move down to take out the 100MA (orange line) followed by the next candle that is a failed back test.
Lastly and most important notice the position of the moving averages. Red (200MA) sits above green (20MA) which sits above purple (10EMA) which sits above orange (100MA) which sits above the lower Bollinger Band.
I will not tell you what comes next once again as to not distract your eyes. You can pull up an SPX daily yourself and see. I even left off the dates 2008 VS 2011. Can you tell which is which?

By Tony Pallotta
Bio: A Boston native, I now live in Denver, Colorado with my wife and two little girls. I trade for a living and primarily focus on options. I love selling theta and vega and taking the other side of a trade. I have a solid technical analysis background but much prefer the macro trade. Being able to combine both skills and an understanding of my "emotional capital" has helped me in my career.
© 2011 Copyright Tony Pallotta - Disclaimer: The above is a matter of opinion provided for general information purposes only and is not intended as investment advice. Information and analysis above are derived from sources and utilising methods believed to be reliable, but we cannot accept responsibility for any losses you may incur as a result of this analysis. Individuals should consult with their personal financial advisors.
© 2005-2022 http://www.MarketOracle.co.uk - The Market Oracle is a FREE Daily Financial Markets Analysis & Forecasting online publication.


