


Stock Market Rally, It's a Trap
Stock-Markets / Stock Markets 2011 Nov 20, 2011 - 06:11 AM GMTBy: Tim_Wood

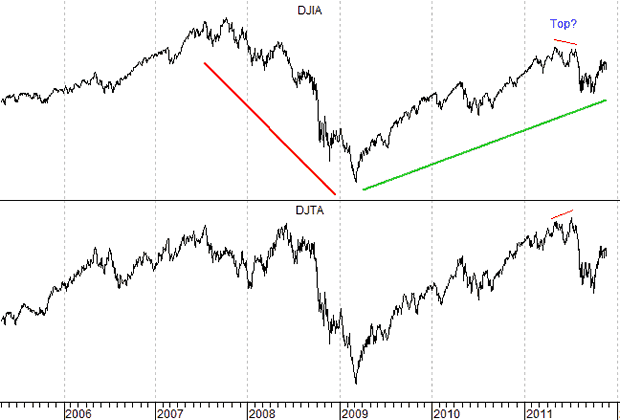
 So far, the high for the year occurred on May 2nd at 12,876 on the Industrials and on July 7th at 5,627.85 on the Transports. In turn, this left an upside non-confirmation in place and on August 4th both the Industrials and the Transports closed below their previous secondary low points. This was the first time since the March 2009 low that this has occurred. In doing so the primary trend turned bearish in accordance with Dow theory.
Also in accordance with Dow theory, once a primary trend change is established, that primary trend is considered to be intact until it is authoritatively reversed. In this case, such a reversal requires a move above the previous secondary high points, which has not occurred. Therefore, according to orthodox Dow theory, the bearish primary trend change remains intact. The current Dow theory chart is included below.
However, in spite of this orthodox bearish Dow theory trend change, history also shows that not all Dow theory trend changes are created equally. Point being, while all major down turns in the market have been accompanied by a Dow theory trend change, not all trend changes have been accompanied by a major downturn. So, to say that just because we have seen a Dow theory trend change and that a major turn has occurred is a bit misleading. Therefore, in my studies I have looked a ALL Dow theory trend changes at both tops and bottoms going back to 1896. In this case we are concerned about potential tops so the context of this article will be with tops in mind. Anyway, what I have found is that while no Dow theory trend change should be taken lightly, including the current one, there are distinguishing differences.
My studies have also shown me that as the secular bull and bear market periods grew, we began to see Dow theory trend changes occur within the context of the longer-term trend. This was first seen in 1946. This also occurred in 1948, 1951, 1953, 1956, 1960, 1962 and 1965. Sure, these were important tops in the market, but none of them marked THE top of the secular bull market. The leading Dow theorist of that time was E. George Schaefer and he recognized that the secular bull market had stretched in duration. As a result, Mr. Schaefer explained that he used his other technical studies, outside of traditional Dow theory, to filter these Dow theory trend changes.
I want to add that during the secular bull market period that ran between 1974 and 2007, there were also a number of traditional Dow theory trend changes. Such trend changes were seen in 1977, 1981, 1984, 1987, 1990, 1998 and as it turns out, even the trend change that occurred at the 2000 top proved to have occurred within the context of the longer-term secular bull market, which appears to have finally peaked in 2007. Again, these were all important tops. But, none of them prior to the 2007 top were THE top. Thus, history clearly shows that Dow theory trend changes are not always ominous nor do they always set the longer-term trend for the market.
With this all said, my long-term view has definitely not changed as I continue to believe that the rally out of the March 2009 low is a bear market rally that will ultimately separate Phase I from Phase II of a much longer-term secular bear market. I also continue to believe that the Phase II decline will be much more devastating than the Phase I decline seen between October 2007 and March 2009. However, as with Mr. Schaefer, based on my other technical studies, I have found that every major top since 1896 has been accompanied by unique DNA markers. It is because these DNA markers were missing in conjunction with the recent Dow theory trend change that I have to question this trend change. I also believe that this Dow theory trend change will ultimately be part of a much more meaningful setup and that once the DNA Markers do appear, all financial hell will break loose. The details of these DNA Markers and their development is covered in my monthly research letters. Until such time as they appear, the overall technical data suggests that a much larger trap for both the bull and bear alike is likely being set.
I have begun doing free market commentary that is available at www.cyclesman.info/Articles.htm The specifics on Dow theory, my statistics, model expectations, and timing are available through a subscription to Cycles News & Views and the short-term updates. I have gone back to the inception of the Dow Jones Industrial Average in 1896 and identified the common traits associated with all major market tops. Thus, I know with a high degree of probability what this bear market rally top will look like and how to identify it. These details are covered in the monthly research letters as it unfolds. I also provide important turn point analysis using the unique Cycle Turn Indicator on the stock market, the dollar, bonds, gold, silver, oil, gasoline, the XAU and more. A subscription includes access to the monthly issues of Cycles News & Views covering the Dow theory, and very detailed statistical-based analysis plus updates 3 times a week.
By Tim Wood
Cyclesman.com
© 2011 Cycles News & Views; All Rights Reserved
Tim Wood specialises in Dow Theory and Cycles Analysis - Should you be interested in analysis that provides intermediate-term turn points utilizing the Cycle Turn Indicator as well as coverage on the Dow theory, other price quantification methods and all the statistical data surrounding the 4-year cycle, then please visit www.cyclesman.com for more details. A subscription includes access to the monthly issues of Cycles News & Views covering the stock market, the dollar, bonds and gold. I also cover other areas of interest at important turn points such as gasoline, oil, silver, the XAU and recently I have even covered corn. I also provide updates 3 times a week plus additional weekend updates on the Cycle Turn Indicator on most all areas of concern. I also give specific expectations for turn points of the short, intermediate and longer-term cycles based on historical quantification.
Tim Wood Archive |
© 2005-2022 http://www.MarketOracle.co.uk - The Market Oracle is a FREE Daily Financial Markets Analysis & Forecasting online publication.