


Stock Market Short-term Top in Sight, After New High
Stock-Markets / Stock Markets 2011 Nov 14, 2011 - 09:23 AM GMTBy: Andre_Gratian

 SPX: Very Long-term trend - The very-long-term cycles are down and, if they make their lows when expected, there will be another steep and prolonged decline (which appears to have already started) into 2014.
SPX: Intermediate trend - The rally from 1075 has consolidated and is ready to make a new high, followed by another consolidation.
Analysis of the short-term trend is done on a daily basis with the help of hourly charts. It is an important adjunct to the analysis of daily and weekly charts which discusses the course of longer market trends.
Market Overview
The rally which started at 1075 in early October had a 218-point rally to 1292 in less than four weeks before pausing. That's a lot of strength which has a lot of former bear market advocates beginning to change their minds. After a ten-day correction which retraced less than .382 of the uptrend, it looks as if the SPX may be ready to extend its move to the low 1300's (see pink box on the chart below).
That would be the logical target. Several trend lines which, collectively, should provide some resistance come together in that area, and they coincide with a P&F count derived from the base which was formed just above 1220.
After this target is reached, it should be followed by another correction, but that is not likely to be the end of the move. Besides the obvious strength in the index, the consolidation which started in early August and lasted into early October created an enormous accumulation base which can lead to higher prices, perhaps even new index highs.
That base has also proven to be an area of strong support. The pull-back from 1292 could not even penetrate the higher layer of the congestion level, and the consolidation formed at its very top. On the Point & Figure chart, that accumulation base is clearly far more substantial than the distribution pattern that was formed at the 1371 top - although it does not look like it on the bar chart. One of the P&F tenets is that when an accumulation base is bigger than the preceding distribution top, the next move should carry to a new high. We'll see if this holds up in this case. In the meantime, as long as we don't see some real weakness coming into the market, it is probably best not to be too bearish.
Chart analysis
After creating a distribution phase below 1371, the SPX finally dropped below 1260 and out of the mid-point channel from the March 2009 low. It found strong support at 1075, just above the bottom channel line (chartreuse line) and started an impressive rally which recovered three quarters of the decline in one fell swoop. This took it outside of a broad declining (red) channel after which it made a corrective pattern in the form of what looks like a triangle. A triangle suggests that prices will break out in the direction of the original move. So, if this is a triangle, and if, early next week, the pattern is completed by a minor pull-back into the 13-wk cycle low, the following move should be up and to a new high.
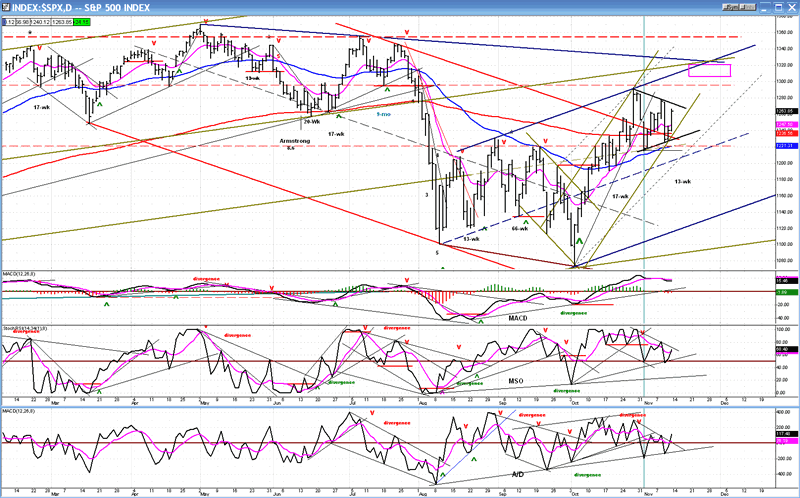
There are a number of factors pointing to a move into the 1306-1326 range. Should this take place, the index would now be in a position to challenge its final downtrend line which, combined with the other trend lines that are drawn on the chart, would likely stop the move -- at least temporarily. If it overcomes that resistance right away (not expected) it would be a feat of extraordinary strength suggesting a resumption of the bull market from 2009.
On the chart, I have also drawn two more channels, one in chartreuse, and a wider one in dark blue. I believe that the dark blue channel represents the current trend, which will end only when the lower trend line is penetrated. It does not look as if this is exactly around the corner! If the SPX does move to the low 1300's over the near-term, it will put it at the top of the blue channel. History suggests that when this happens, the stock or index will usually travel in the top part of the channel for a while, eventually dropping into the bottom half as deceleration sets in, and finally breaks through the bottom trend line. If that pattern is repeated, we could be well into 2012 before this happens.
Let's look at the Hourly Chart. During the correction, the price traveled down to the 1216 level where it found good support and continued its consolidation at a higher level. It seems to be building a triangle which would be complete with one more little drop into the 13-wk cycle which is due on Monday/Tuesday. Will we get it? Berlusconi has now resigned after politicians approved drastic cuts in the Italian budget, and a new successor has been chosen. Will that send prices up instead of down?
The little green area drawn on the chart at the end of the consolidation gives us a projection to a maximum of 1326 on the P&F chart. That's slightly beyond the resistance level at the top of the dark-blue channel, but even if we fall a little short of that target, it will still satisfy the count.
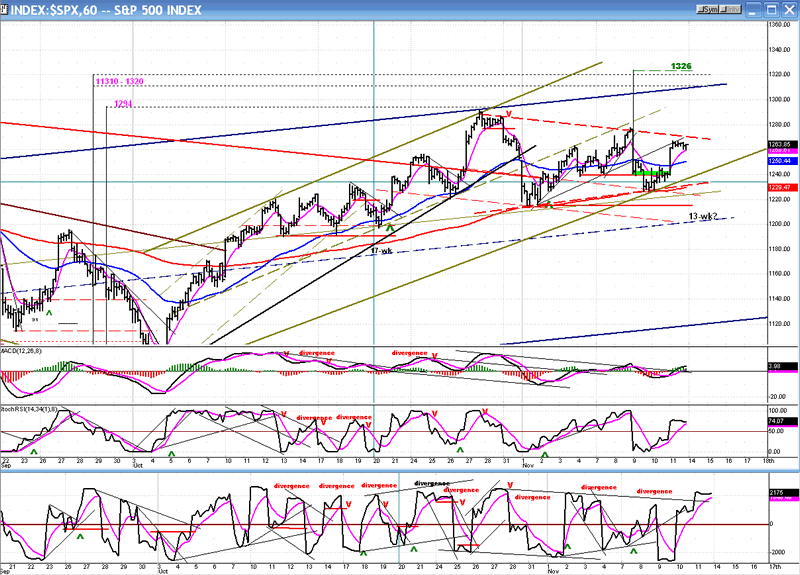
I had been waiting to see if prices would hold above 1220, and they have. Note that the last two lows also rest on the red 200-hr MA which often acts as support or resistance (look at the beginning of the chart where it turned out to be resistance). Should the price break out to the downside instead of up, it could put a crimp in our bullish scenario.
Cycles
The 13-wk cycle is due on Monday or Tuesday. Afterwards, there are, to my knowledge, no significant cycles due to bottom until late December.
Breadth
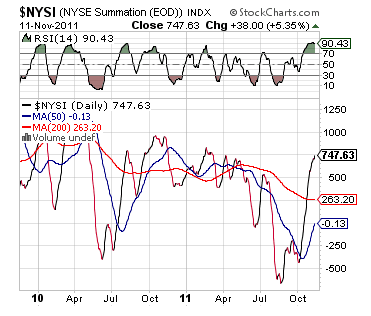
The NYSE Summation Index (courtesy of StockCharts.com) has continued to rise even though the market was correcting. That's impressive and it should dissuade anyone who thinks that the uptrend is nearly over. It's true that I am expecting more correction after the SPX reaches the top of its dark-blue channel, and the overbought status of the RSI on this chart confirms that one is due shortly, but I would be surprised if this rise was followed by a resumption of the long-term downtrend. Before this happens, I would expect to see some deceleration and even negative divergence in this indicator.
Sentiment
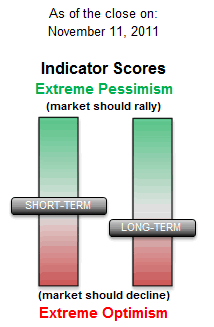
The SentimenTrader (courtesy of same) has paused well short of a deep excursion into the red, which would signal an important top in the making. No warning signal, yet, from this indicator.
QQQ
Nor is there any from the QQQ. After rising within touching distance of its July top a few days ago, the index has gone into a shallow consolidation which also fell short of a .618 retracement of the previous uptrend. The larger picture is similar to that of the SPX, with the index also making what appears to be a triangle pattern.
Should we get the up-move that I am expecting n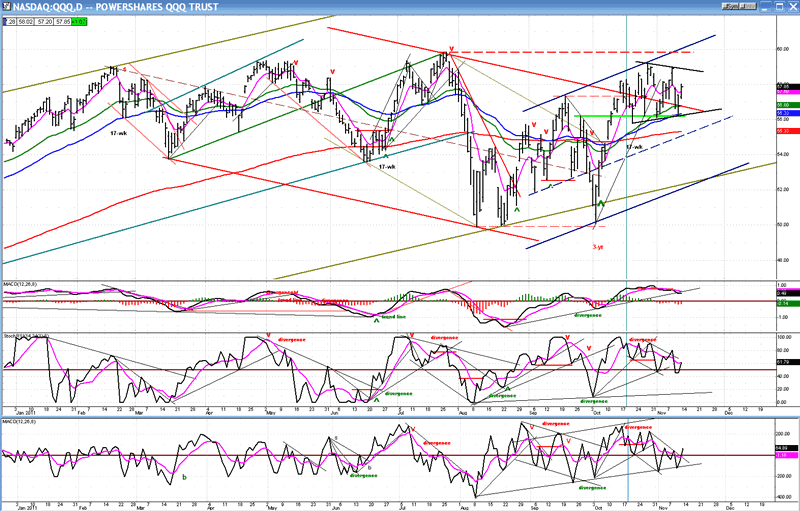 ext week, there is a good chance that the QQQ will make a new high. This is something that (as you must remember) I had foreseen some time ago. And, of course, this would continue to make it stronger than the SPX, on a relative basis, telling us to relax if we are expecting a major top anytime soon
FINANCIAL INDEX
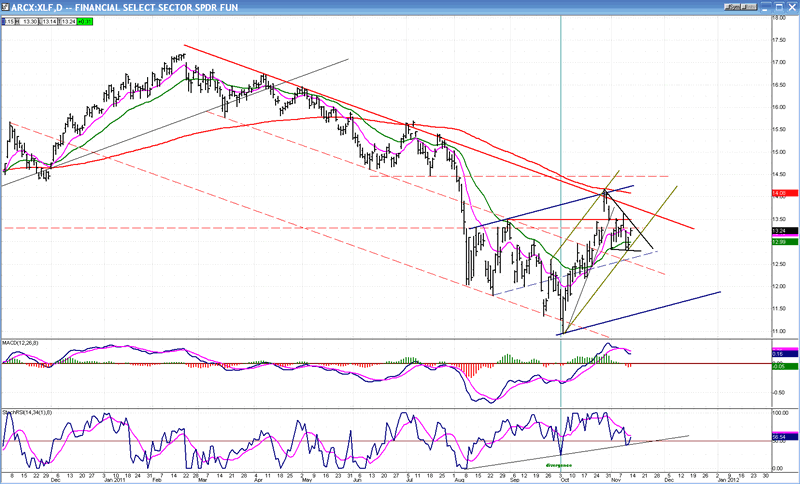
Not all the indices are in a position to make a new high. Here is a chart of the XLF. This index has always been considered a leading indicator, but right now it is following. It does have the same intermediate trend pattern that the stronger indices have, which suggests higher prices.
The index has not yet broken out of its down channel. It's recent attempt was defeated when it met the top of the channel at the same time that it touched the 200-DMA. Its rally was also equivalent to a 50% retracement of the downtrend from February. That was just too much for the index to handle all at once, and it fell back. The good news is that it only retraced about .382 of its advance from the low.
My interpretation of the market action is that, since no weakness is showing in the intermediate trend of any of the indices, that the trend will continue positive for some time to come. This will lead to higher highs in some indices (like the QQQ), but others will fall short. The XLF is one of them and, this tells us that there will eventually be trouble down the line. Of course, this is what we expect as the very long-term cycles make their lows in 2014.
It will be important to watch for signs of intermediate-term weakness in the XLF. It cannot be a leader on the upside in this economic atmosphere, but it continues to lead on the downside. At the last two important tops (October 2007, and May 2011), the XLF gave notice of a new downtrend well ahead of the rest of the market. I expect it to do the same when this intermediate trend has run its course.
Summary
Last week's headline was: "Intermediate Trend Still Alive". It was, and is! The indices have done very little retracing of their gain from early October, and appear ready to resume their move upward.
The ideal would be to have a small retracement on Monday in order to complete what appears to be a triangle pattern, and then move up to meet the P&F target in the low 1300s. This move, however, would be likely to usher in another noteworthy correction.
FREE TRIAL SUBSCRIPTON
If precision in market timing for all time frames is something which is important to you, you should consider a trial subscription to my service. It is free, and you will have four weeks to evaluate its worth.
For a FREE 4-week trial. Send an email to: ajg@cybertrails.com
For further subscription options, payment plans, and for important general information, I encourage you to visit my website at www.marketurningpoints.com. It contains summaries of my background, my investment and trading strategies and my unique method of intra-day communication with Market Turning Points subscribers.
By Andre Gratian
MarketTurningPoints.com
A market advisory service should be evaluated on the basis of its forecasting accuracy and cost. At $25.00 per month, this service is probably the best all-around value. Two areas of analysis that are unmatched anywhere else -- cycles (from 2.5-wk to 18-years and longer) and accurate, coordinated Point & Figure and Fibonacci projections -- are combined with other methodologies to bring you weekly reports and frequent daily updates.
“By the Law of Periodical Repetition, everything which has happened once must happen again, and again, and again -- and not capriciously, but at regular periods, and each thing in its own period, not another’s, and each obeying its own law … The same Nature which delights in periodical repetition in the sky is the Nature which orders the affairs of the earth. Let us not underrate the value of that hint.” -- Mark Twain
You may also want to visit the Market Turning Points website to familiarize yourself with my philosophy and strategy.www.marketurningpoints.com
Disclaimer - The above comments about the financial markets are based purely on what I consider to be sound technical analysis principles uncompromised by fundamental considerations. They represent my own opinion and are not meant to be construed as trading or investment advice, but are offered as an analytical point of view which might be of interest to those who follow stock market cycles and technical analysis.
Andre Gratian Archive |
© 2005-2022 http://www.MarketOracle.co.uk - The Market Oracle is a FREE Daily Financial Markets Analysis & Forecasting online publication.