


Stock Market Important Short Term Juncture
Stock-Markets / Stock Markets 2011 Nov 13, 2011 - 05:09 AM GMTBy: Tony_Caldaro

 Volatile week ends mixed to lower in world equity markets. After an 18 day, 20.3%, rally from SPX 1075 to 1293 the market has spent the past eleven trading days between 1215 and 1287. Positive economic reports for the week outnumbered negative reports, for the first time in many weeks, two to one. On the downtick: wholesale inventories, import/export prices and the monetary base. On the uptick: consumer credit, the twin deficits, consumer sentiment, the M1-multiplier, the WLEI and weekly jobless claims improved. For the week the SPX/DOW were +1.15%, but the NDX/NAZ were -0.15%. Asian markets declined 2.2%, European markets gained 0.5%, and the DJ World was -0.2%. Next week we have a slew of important economic reports, and it’s Opex week.
LONG TERM: neutral
We continue to remain neutral long term for several reasons. After the market declined in five waves from May11 @ SPX 1371 to Oct11 @ SPX 1075 we identified that important low two days after it occurred. Then as the market rallied, in what appeared to be a B wave retracement rally, it took on the look of an ongoing impulse wave. This was a bit of a surprise as we only expected a rally to SPX 1258, and possibly a bit more, to overlap the first wave of the five wave decline and retrace 61.8% of the decline. We expected the uptrend to be choppy, but it impulsed right up to SPX 1293. See daily SPX chart.
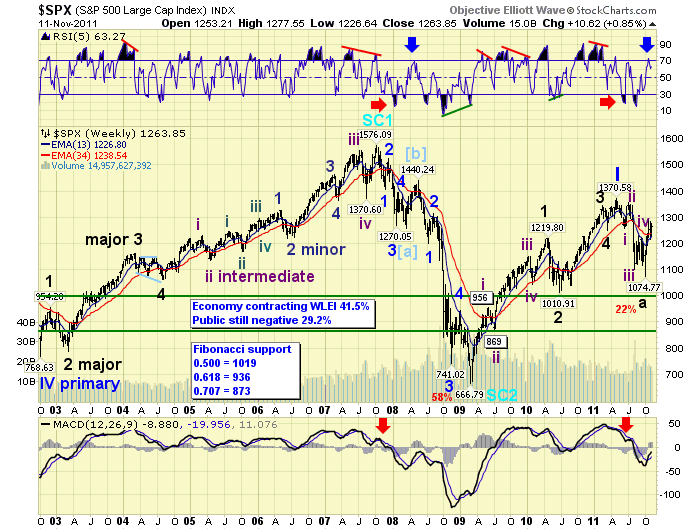
Historical analysis of Primary II waves suggested, once the 61.8% retracement level was exceeded, a potential 12 month bear market could unfold with a Major B wave that could retest, (within -3.5% to +1.0%), the bull market high. This allows this Major B to continue higher, reaching between SPX 1323 and 1383. The implusive looking rally, however, suggests it was either an Intermediate wave A of an ongoing Major wave B, or the bear market actually ended at SPX 1075. In either case we would have expected to see higher prices in the next few months before seeing SPX 1075 again, if at all. However, there is a possibility that Major wave B concluded at the recent high. We’ll get into that in the next section.
MEDIUM TERM: uptrend may have topped at SPX 1293
The uptrend, that started in the beginning of October, first ran into resistance at the Int. iv SPX 1231 high, then the Int. i SPX 1258 low, and finally the series of resistance levels going back several months in the lower 1290′s. This was quite a strong impulsive surge lasting only 18 trading days and retracing 74% of the entire five wave, five month, decline from SPX 1371 to 1075.
We initially started counting this rally as a series of zigzags and have that count still posted on the SPX charts. When it started looking more impulsive that corrective we added a more bullish count on the DOW charts, and switched from long term bearish to long term neutral. Before making the long term bullish/bearish determination we need to observe this uptrend, in its entirety, and the next downtrend. If this uptrend remains impulsive and the following downtrend is corrective we’ll turn bullish. If this uptrend ends in a corrective fashion we’ll return to long term bearish.
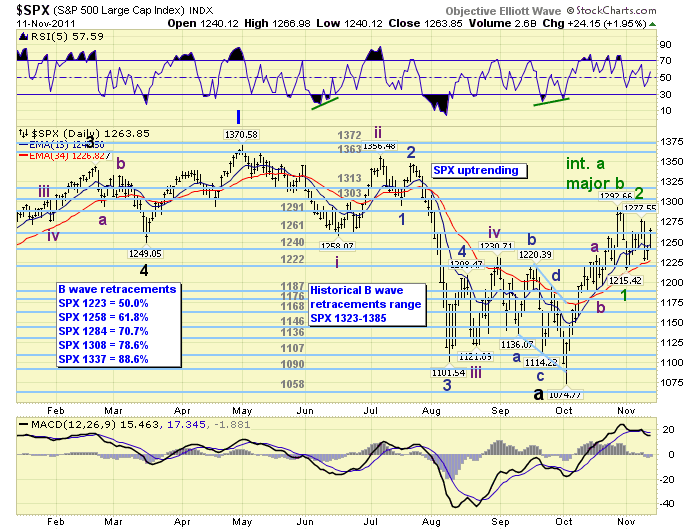
After the SPX 1293 uptrend high two weeks ago this market started to turn choppy. We have had a sharp 3 day decline to SPX 1215, a 4 day rally to SPX 1278, a 1 day decline to SPX 1227 and now a 2 day rally to SPX 1267. When the 4 day rally looked corrective and then turned down we went into the defensive mode, posting a potential uptrend high at SPX 1293, and Minor wave 1 and 2 at SPX 1215 and SPX 1273 respectively. To eliminate this count the market will first need to rally beyond SPX 1278, and then SPX 1293. This would suggest the alternate count posted: an Int. wave A at SPX 1293, and an Int. wave B at SPX 1215 with Int. wave C underway. It could also mean that this uptrend is turning choppy and the Major B wave bear market scenario is again in force. Should this occur we would expect the SPX 1075 level to be revisited and possibly exceeded in 2012.
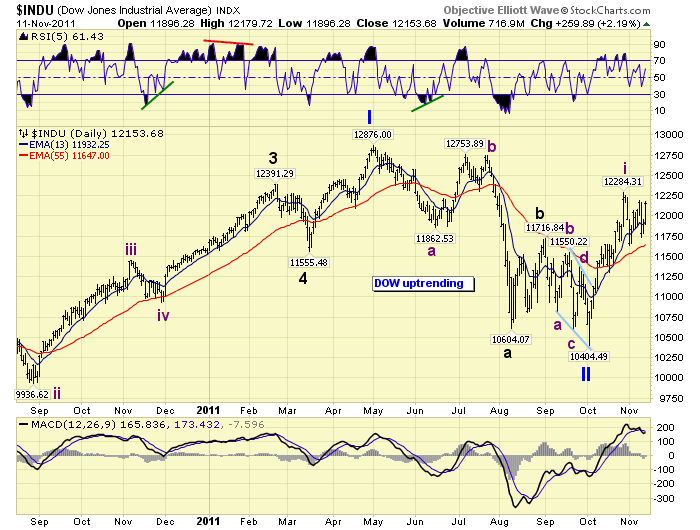
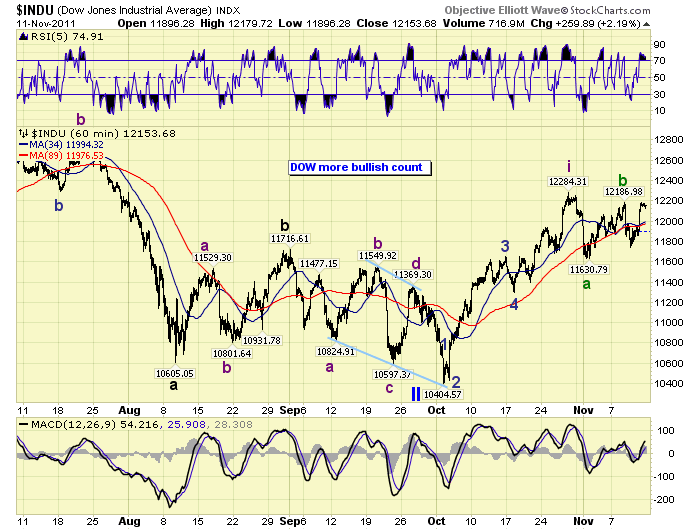
The DOW charts post a more bullish SPX count, with similar short term parameters, where we labeled the SPX 1293 high as the end of Intermediate wave one. Intermediate wave two would be underway now.
SHORT TERM
Support for the SPX is at 1261 and then 1240, with resistance at 1291 and then 1303. Short term momentum ended the week overbought. Short term OEW charts will remain positive as long as the market holds SPX 1250. Should this uptrend continue, the Int. C wave scenario, we have three fibonacci overhead resistance levels ahead: SPX 1298 (Int. C = 0.382 Int. A), SPX 1324 (Int. C = 0.50 Int. A), and SPX 1350 (Int. C = 0.618 Int. A). There are OEW overhead pivots at 1291, 1303, 1313 and then 1363. The historical Major B scenario suggests a range between SPX 1323 and 1385.
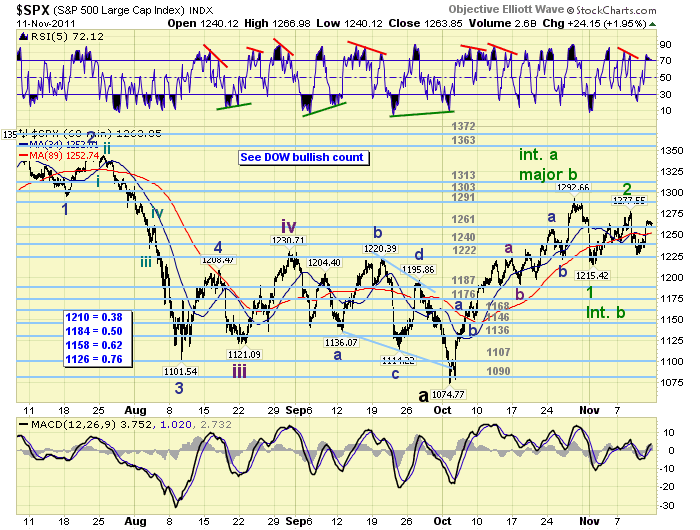
If the uptrend concluded at SPX 1293, in the impulsive mode, we have several fibonacci support levels targeted. SPX 1210 = 0.382 Int. i, SPX 1184 = 0.50 Int. i, SPX 1158 = 0.618 Int. i, and SPX 1126 = 0.764 Int. i. These levels are posted on the SPX 60min chart above. The recent rally from SPX 1215 to 1278 retraced 76.4% of the decline from 1293 to 1215. Below is the more bullish 60min count posted on the DOW charts.
FOREIGN MARKETS
The Asian markets were mostly lower on the week for a net loss of 2.2%. All confirmed uptrends with the exception of Hong Kong’s HSI.
The European markets were mixed for a net gain of 0.5%. All are in confirmed uptrends.
The Commodity Equity group were all lower on the week for a net loss of 0.7%. Only Brazil’s BVSP is in a confirmed uptrend.
The DJ World index is uptrending, but lost 0.2% on the week.
COMMODITIES
Bond prices are getting quite close to confirming an uptrend. Bonds lost 0.4% on the week.
Crude has been uptrending since early October and gained 5.1% on the week.
Gold is in an uptrend as well and gained 1.9% for the week.
The USD remains in an uptrend, a volatile one at that, and was flat on the week.
NEXT WEEK
Busy week ahead. On tuesday we have the PPI, Retail sales, the NY FED and Business inventories. Wednesday, the CPI, Industrial production, and NAHB housing. Thursday, weekly Jobless claims, Housing starts, Building permits and the Philly FED. Then on friday Leading indicators and Options expiration. Nothing scheduled, at this time, for the FED. It appears we are an important juncture that can swing either way in the short term. Keep an eye on European markets. Their sovereign debt crisis is driving markets worldwide. Best to your week!
CHARTS: http://stockcharts.com/...
http://caldaroew.spaces.live.com
After about 40 years of investing in the markets one learns that the markets are constantly changing, not only in price, but in what drives the markets. In the 1960s, the Nifty Fifty were the leaders of the stock market. In the 1970s, stock selection using Technical Analysis was important, as the market stayed with a trading range for the entire decade. In the 1980s, the market finally broke out of it doldrums, as the DOW broke through 1100 in 1982, and launched the greatest bull market on record.
Sharing is an important aspect of a life. Over 100 people have joined our group, from all walks of life, covering twenty three countries across the globe. It's been the most fun I have ever had in the market. Sharing uncommon knowledge, with investors. In hope of aiding them in finding their financial independence.
Copyright © 2011 Tony Caldaro - All Rights Reserved Disclaimer: The above is a matter of opinion provided for general information purposes only and is not intended as investment advice. Information and analysis above are derived from sources and utilising methods believed to be reliable, but we cannot accept responsibility for any losses you may incur as a result of this analysis. Individuals should consult with their personal financial advisors.
© 2005-2022 http://www.MarketOracle.co.uk - The Market Oracle is a FREE Daily Financial Markets Analysis & Forecasting online publication.