


Silver Is Ready, Are You?
Commodities / Gold and Silver 2011 Nov 02, 2011 - 07:31 PM GMTBy: Hubert_Moolman

 In my previous silver update, I presented the following chart, which indicated that silver was at a major crossroads:
I wrote the following: “The current pattern on the silver chart is in fact a highly bullish pattern. It is consistent with that which forms right before price goes parabolic. However, this type of pattern is also similar to that which forms just before we have a severe decline. That, I believe, is the reason why opinion is always divided before one sees a huge rise in price.”
Based on my Fractal analysis, I made the case for silver rising, therefore, choosing the “green path”. It appears that silver has now confirmed its intention to follow that green path. Below, is the updated chart:
On the chart, I have highlighted a possible flag, which could have a target in the $70 area, should it break out in the $40 dollar area.
I said before that the current pattern on the silver chart is an extremely bullish pattern. It is no ordinary flag. It is a pattern that often appears before a good goes parabolic. Provided that the silver price can breach the relevant resistance over the next couple of weeks, it will increase dramatically over the next couple of months.
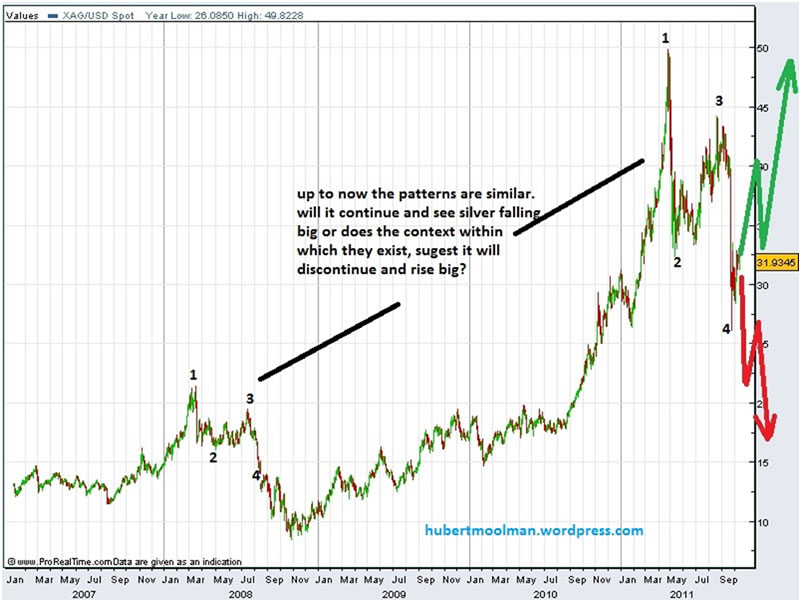
This pattern on the silver chart has me convinced that silver will rise even faster than a lot of silver bulls are expecting. Let me give you an example of what is likely to come next, after this pattern. Below, is a comparison of the current pattern on the silver chart, and a similar pattern that was on the gold chart in 2007:
The gold chart is the top one. I have marked similar points (1 to 5), on both charts, to illustrate how the patterns are similar. Note, that the silver pattern is a much larger pattern (time-wise). I have also indicated where I think we are currently, on the silver chart, compared to the gold chart.
It is important to understand that these patterns cannot be randomly compared. One has to determine whether the context in which they exist, are similar. I deal with this in more detail, in my special Fractal Analysis reports. Also, most importantly, the fundamentals should also tell the same story, within context.
So, what happened next on the gold chart, and therefore, by extrapolation, what is likely to happen next on the silver chart? Below, is the gold chart, illustrating what happened after the formation of the pattern.
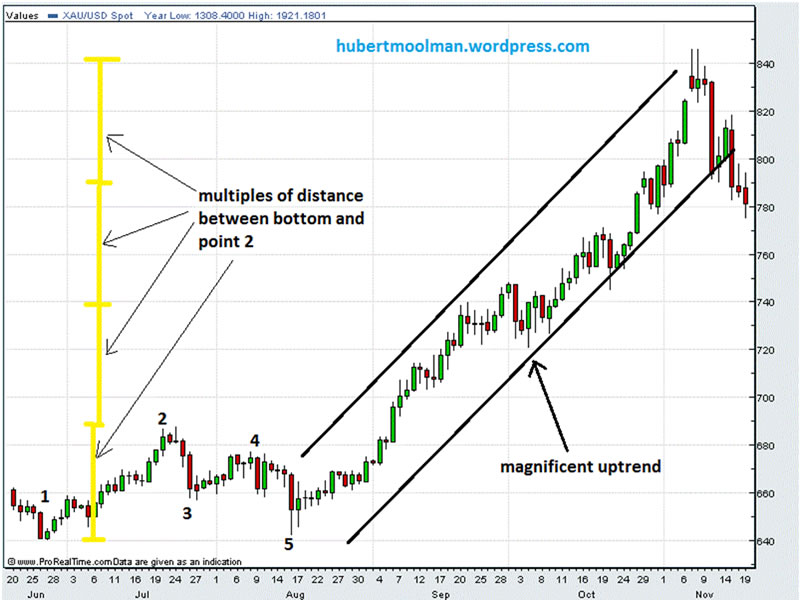
The gold price rose significantly over the following couple of months, making all-time highs.
If you measure the price distance between the low, and point 2, you will find that the gold price went three times that distance, higher than point 2. If silver emulates that, it should go to $140 (30*3 + 50) as a minimum. Due to the nature of silver, it is likely to better gold's performance.
In any case, the point is not to calculate a target here, but to show you how potentially bullish the pattern on the silver chart is. If you would like to get more of this type of analysis for gold, silver and gold & silver mining stocks, you can subscribe to my premium service. I have also recently finished a Gold Mining Report that covers the XAU, HUI and the GDX as well as a long-term Gold Fractal Report. For more details see my website.
Warm regards and God bless,
Hubert
Please visit my blog and website for more of my work and premium service. http://hubertmoolman.wordpress.com/
You can email any comments to hubert@hgmandassociates.co.za
© 2011 Copyright Hubert Moolman - All Rights Reserved
Disclaimer: The above is a matter of opinion provided for general information purposes only and is not intended as investment advice. Information and analysis above are derived from sources and utilising methods believed to be reliable, but we cannot accept responsibility for any losses you may incur as a result of this analysis. Individuals should consult with their personal financial advisors
© 2005-2022 http://www.MarketOracle.co.uk - The Market Oracle is a FREE Daily Financial Markets Analysis & Forecasting online publication.