


Stock Market Down Movements and the Volatility Index's Concentric Circle Pattern
Stock-Markets / Volatility Dec 18, 2007 - 01:21 PM GMTBy: Marty_Chenard

 It has been months since I posted our VIX Concentric Circle chart . It has always been one of the free subscriber favorites in the past.
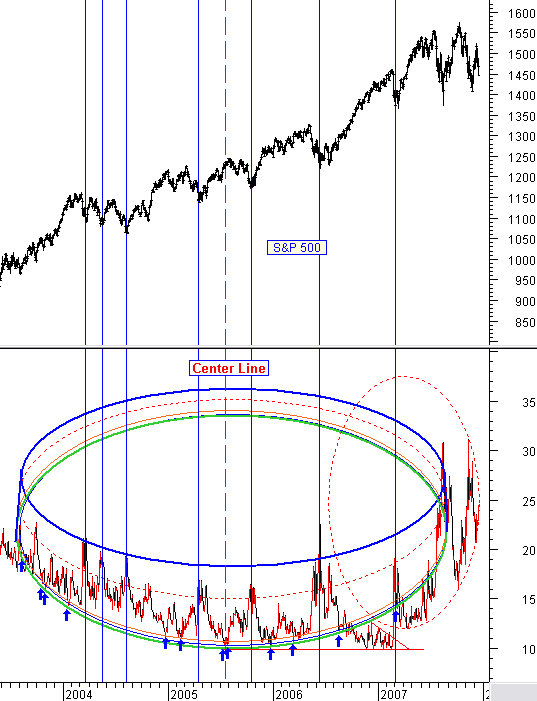
From 2003 to mid 2006, the Volatility Index followed a perfect concentric circle pattern where the bottom of the circle was the Support for the VIX as seen below.
In mid 2006 it broke the pattern, but that was the starting base for an upside trend that would start a new "oval circle" with the VIX moving higher and the oval being the support level that the VIX would bounce off of as it moved higher. The higher the VIX moves, the higher the fear level, and the more investors sell.
See the next chart ...
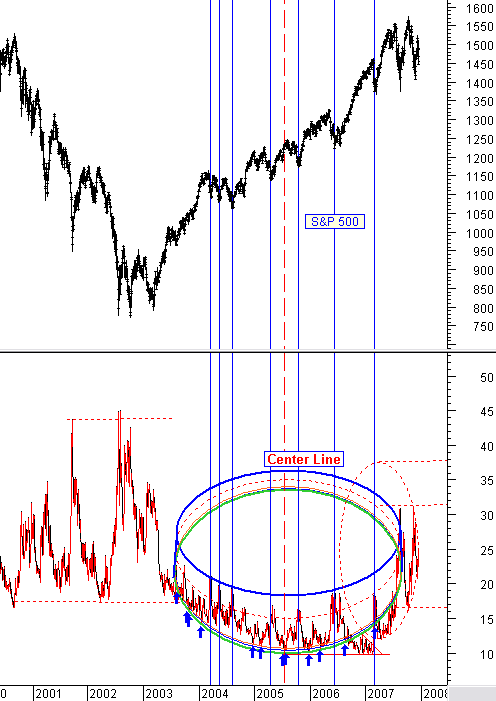
This is the same chart as above, but this one goes back to 2001 and encompasses the Bear Market period.
Note how the VIX was much higher and more volatile during the Bear Market period. The current oval pattern is starting to mimic that time period.
What could happen now? The oval support could be broken to the downside and correspond to another wave up, or establish a higher bottom support level where we get high oscillations within a trading range. If the later case occurs, then we will see the market move into a correction period where the indexes will make lower/tops and lower/lows.
We are now at a critical, long term pivot point where the Fed better get their actions right and real soon .
By Marty Chenard
http://www.stocktiming.com/
Please Note: We do not issue Buy or Sell timing recommendations on these Free daily update pages . I hope you understand, that in fairness, our Buy/Sell recommendations and advanced market Models are only available to our paid subscribers on a password required basis. Membership information
Marty Chenard is the Author and Teacher of two Seminar Courses on "Advanced Technical Analysis Investing", Mr. Chenard has been investing for over 30 years. In 2001 when the NASDAQ dropped 24.5%, his personal investment performance for the year was a gain of 57.428%. He is an Advanced Stock Market Technical Analyst that has developed his own proprietary analytical tools. As a result, he was out of the market two weeks before the 1987 Crash in the most recent Bear Market he faxed his Members in March 2000 telling them all to SELL. He is an advanced technical analyst and not an investment advisor, nor a securities broker.
Marty Chenard Archive |
© 2005-2022 http://www.MarketOracle.co.uk - The Market Oracle is a FREE Daily Financial Markets Analysis & Forecasting online publication.