


Is the U.S. Consumer Spending Surge a 'Dance of Economic Death'?
Economics / Double Dip Recession Oct 31, 2011 - 03:08 AM GMTBy: Clif_Droke

 The latest economic headline came as a surprise to the pundits, though it actually makes perfect sense from a psychological standpoint. On Friday the Associated Press informed us of "Americans spending more with income almost flat," per the headline. At first glance this seems almost counterintuitive, yet the sub-heading of this A.P. story put it into perspective: "Americans find tiny returns on savings and decide to spend."
The economists interviewed by the A.P. put a spin on this story to the effect that Americans are spending more because they're earning next to nothing in interest on savings in the bank. For instance, the annual yield on six-month certificates of deposit is currently 0.23 percent, according to Bankrate.com. Five years ago it was 3.62 percent. As the A.P. article stated, "If you put your money in the six-month CD today, you'd make about enough to buy a burger."
It's a conundrum that has perplexed economists and is difficult to explain. Have consumers essentially embraced an "eat, drink, for tomorrow we die!" attitude toward spending in a sluggish economy - a dance of death if you will? Has discretionary spending supplanted the need for saving among a jaded populace worn out by four years of recession? Or have consumers simply been forced to spend a greater part of their incomes on rising fuel and food costs? The answer is a combination of each of these rationales for spending, as we'll discuss here.
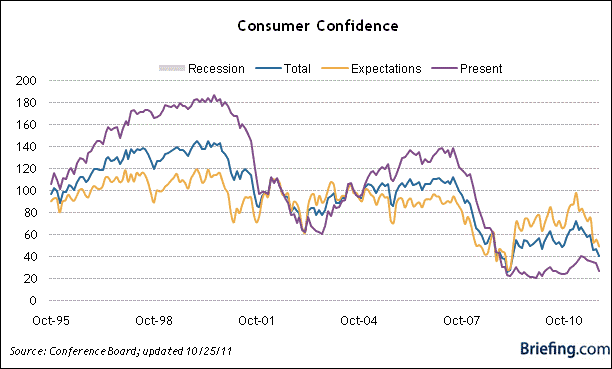
There are three basic components behind the increased consumer spending in a stagnant economy. The first is psychological. Despite the low consumer confidence ratings of recent months (see chart below), consumers are spending more this year on discretionary items as well as on necessities. One reason for this is the "echo effect" of the financial market rebound of the last couple of years. Studies have shown that investors and consumers tend to be 2-3 years behind the curve of a financial market trend. That is, investors who were scared onto the sidelines by a stock market crash will usually wait up to two or three years before re-entering the market, but only if stocks have advanced during that time.
Consumers were shell shocked into curtailing their spending by the recession and credit crash of 2008-2009, but have slowly emerged from hiding in the past year, particularly in the upper income brackets. Spending on luxury goods - from cars to furniture to designer clothing - has risen dramatically in the last year alone. Meanwhile, even the beleaguered middle class consumer has gone from being a big saver (after the credit crash) to a heavy spender. This transformation can also be at least partly attributed to the stimulus-fueled market rally of the last two-and-a-half years. The middle class is tired of seeing the upper classes driving around in BMWs and Mercedes while they scrimp and save to no avail as retail prices continue to rise. So they have finally capitulated to the ingrained (some would say American) urge to shop and spend. A recent book by Lee Eisenberg answers to this primal urge, viz. "Shoptimism: Why the American Consumer Will Keep on Buying No Matter What."
The second reason for the increased spending patterns of consumers is a simple personal finance issue. As the A.P. article quoted above suggests, consumers are reacting to the ultra-low interest rates of the last two years with a "silent revolt." Instead of verbally protesting, they are protesting with their wallets. Rather than watch the value of their savings erode by the Fed's loose money policy, many of them have decided to purchase hard assets and other goods that at least have a practical use and can serve as a substitute for financial market investing. Perversely, consumers' decision to spend rather than save play right into the hands of the Fed by giving it exactly what it wanted in the first place, namely increased consumer spending to keep the domestic economy rolling. This is just one of the many tricks Bernanke has up his sleeve to keep the economy relatively stable for as long as possible as the Fed tries to figure out how best to combat the deflationary long-term trend created by the 60-year down cycle.
A third reason for the surge in consumer spending can be ascribed to the residual momentum generated by the recently peaked 6-year cycle. A similar phenomenon was witnessed back in late 2009 when the 10-year cycle peaked, and again in 1999 when the 30-year cycle peaked (all of these cycles are components of the aforementioned 60-year cycle). In the 2009 and 1999 cases, the yearly cycle peaks were followed by an additional surge of spending for at least a few months resulting from the momentum created by the upward phase of these cycles. Simply put, a cycle generates its own momentum and, depending on how close it is to peaking or bottoming, this momentum tends to carry over beyond the mid-point of the cycle until the momentum either dissipates on its own or until it is reversed by an outside force.
The consumer confidence chart shown above is typical of most economic indicators in that it is a poor overall reflection of what economic actors (i.e. consumers) are really doing right now. A better indicator of what consumers are doing now, and what they'll likely continue doing in the foreseeable short-term future, is found in the New Economy Index (NEI). I've updated this indicator for the benefit of readers for the last couple of years, though plenty of skepticism has been expressed over the validity of this indicator. Yet in spite of the simplicity (some would say overly simplistic) nature of this indicator, it has consistently tracked and/or predicted the main direction of U.S. retail spending patterns since before the credit crisis began. Below is a recent update of the NEI chart.
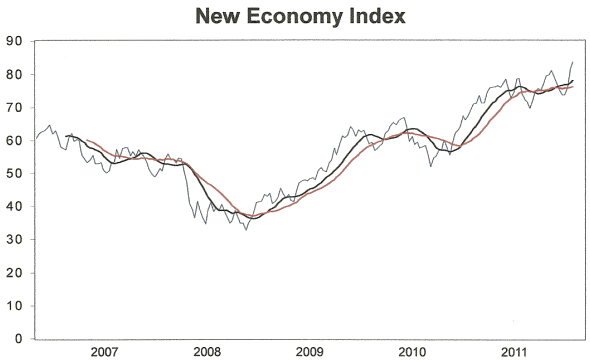
The interpretation of this chart is straightforward: when the indicator itself is in a rising trend above its 12-week (black line) and 20-week (red line) moving averages, the U.S. retail spending economy for consumers and businesses is considered to be improving (or at least holding steady). If the two moving averages are in a confirmed decline, then the short-term retail economic outlook is bearish. To date this indicator has reflected a buoyant economic outlook in terms of retail spending as we head into the critical Christmas shopping season. Thus, the economy will probably be able to end the year on a relatively positive note in spite of the fact that the middle class is still in a wage and balance sheet recession and the jobless rate is still high.
At the end of the day, Fed Chairman Bernanke's easy money policy of the last couple of years is doing exactly what it was intended for. As Eric Green, chief U.S. economist at TD Securities observed, the Fed's policies are "designed to reward spending and effectively punish savers." The latest data suggests it is doing just that.
Price of Gold
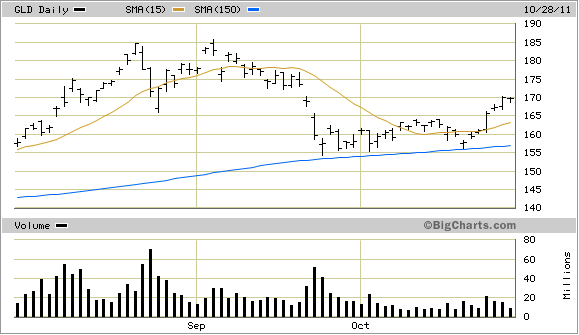
After building support above the dominant longer-term 30-week (150-day) moving average for four weeks, the gold price confirmed a breakout signal last week on news that an agreement which addresses the euro zone debt crisis by Europe's financial ministers was close to being finalized.
The SPDR Gold Trust ETF (GLD), our gold proxy, up until last week had been overshadowed by the recent margin requirement increases in gold but this point was made moot by Tuesday's (Oct. 25) 2.84% upside move on increasing volume. The intensity of last week's breakout suggests it was more than just short covering or reactionary buying due to the news coming out of Europe. It also suggests that this could be the start of an interim recovery for gold. Ironically, gold stands to benefit from both the uncertainty surrounding the European sovereign debt situation as well as any jubilation resulting from makeshift plans for dealing with the debt (as this entails dollar weakness).
Gold & Gold Stock Trading Simplified
With the long-term bull market in gold and mining stocks in full swing, there exist several fantastic opportunities for capturing profits and maximizing gains in the precious metals arena. Yet a common complaint is that small-to-medium sized traders have a hard time knowing when to buy and when to take profits. It doesn't matter when so many pundits dispense conflicting advice in the financial media. This amounts to "analysis into paralysis" and results in the typical investor being unable to "pull the trigger" on a trade when the right time comes to buy.
Not surprisingly, many traders and investors are looking for a reliable and easy-to-follow system for participating in the precious metals bull market. They want a system that allows them to enter without guesswork and one that gets them out at the appropriate time and without any undue risks. They also want a system that automatically takes profits at precise points along the way while adjusting the stop loss continuously so as to lock in gains and minimize potential losses from whipsaws.
In my latest book, "Gold & Gold Stock Trading Simplified," I remove the mystique behind gold and gold stock trading and reveal a completely simple and reliable system that allows the small-to-mid-size trader to profit from both up and down moves in the mining stock market. It's the same system that I use each day in the Gold & Silver Stock Report - the same system which has consistently generated profits for my subscribers and has kept them on the correct side of the gold and mining stock market for years. You won't find a more straight forward and easy-to-follow system that actually works than the one explained in "Gold & Gold Stock Trading Simplified."
The technical trading system revealed in "Gold & Gold Stock Trading Simplified" by itself is worth its weight in gold. Additionally, the book reveals several useful indicators that will increase your chances of scoring big profits in the mining stock sector. You'll learn when to use reliable leading indicators for predicting when the mining stocks are about o break out. After all, nothing beats being on the right side of a market move before the move gets underway.
The methods revealed in "Gold & Gold Stock Trading Simplified" are the product of several year's worth of writing, research and real time market trading/testing. It also contains the benefit of my 14 years worth of experience as a professional in the precious metals and PM mining share sector. The trading techniques discussed in the book have been carefully calibrated to match today's fast moving and volatile market environment. You won't find a more timely and useful book than this for capturing profits in today's gold and gold stock market.
The book is now available for sale at: http://www.clifdroke.com/books/trading_simplified.html
Order today to receive your autographed copy and a FREE 1-month trial subscription to the Gold & Silver Stock Report newsletter. Published twice each week, the newsletter uses the method described in this book for making profitable trades among the actively traded gold mining shares.
By Clif Droke
www.clifdroke.com
Clif Droke is the editor of the daily Gold & Silver Stock Report. Published daily since 2002, the report provides forecasts and analysis of the leading gold, silver, uranium and energy stocks from a short-term technical standpoint. He is also the author of numerous books, including 'How to Read Chart Patterns for Greater Profits.' For more information visit www.clifdroke.com
© 2005-2022 http://www.MarketOracle.co.uk - The Market Oracle is a FREE Daily Financial Markets Analysis & Forecasting online publication.