Stock Market, How Are Large Speculators Positioned
Stock-Markets / Stock Markets 2011 Oct 31, 2011 - 03:01 AM GMTBy: Tony_Pallotta
 As previously stated the Commitment Of Trader's Report is a wealth of information as it discloses long and short positions across the entire futures and commodity complex. I want to share with you some aggregated data on one specific group, non-commercial which represents hedge funds, banks, anyone considered a large speculator.
The basis for the three charts below is that large speculators will have a position on either short or long and use a hedge to manage risk and adjust the overall position. This is no different than a retail trader who may hold SPY puts and hedge by selling and buying puts against the underlying position.
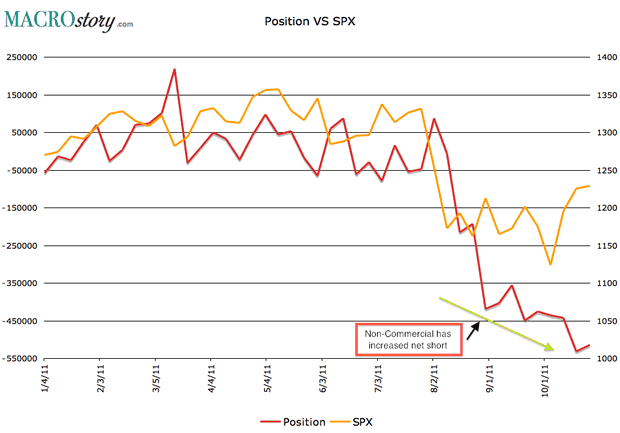
Chart 1 - Position VS SPX
The "position" shown below is the net position for multiple asset classes combined into one. Throughout the year it has correlated very well with the SPX. Notice how during August, September and even October this position has increased in overall net short.

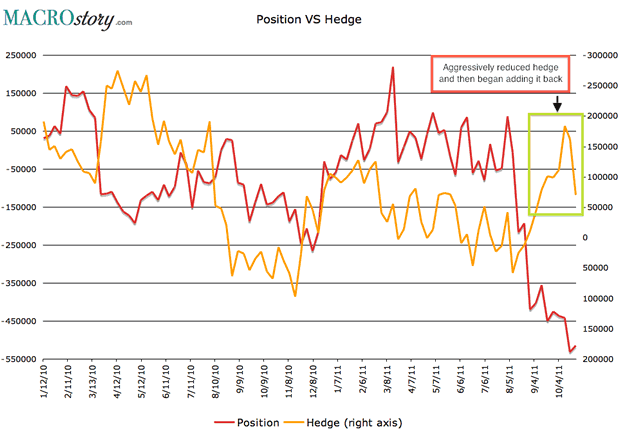
Chart 2 - Hedge VS Position
Similar to the "position" the hedge consists of net positions across various asset classes combined into one "hedge." Notice how non-commercial began reducing their hedge in August to expand their overall net short position.
This would be similar to a retail trader who feels the downside risk has increased and reduces their short put hedge for they want to capture more downside. It is not until the Dexia ramp that they begin to aggressively add back their hedge to reduce overall exposure.

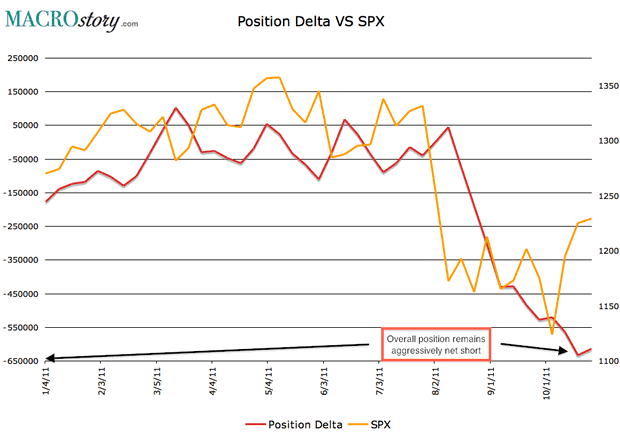
Chart 3 - Position Delta
Delta means how directional a trade is. If delta is negative the trade is positioned for lower prices and if positive higher prices. The more negative delta the more the position profits in falling prices and vice versa. By combining charts 1 and 2 above you can get an overall position delta for non-commercial traders.

Bottom line
Right or wrong, non-commercial is not buying this rally. They have actually increased their net short position and simply increased their hedge over the past few weeks to manage short term upside risk. If they were truly behind this move you would expect a sharp reduction not expansion in their overall position.
By Tony Pallotta
Bio: A Boston native, I now live in Denver, Colorado with my wife and two little girls. I trade for a living and primarily focus on options. I love selling theta and vega and taking the other side of a trade. I have a solid technical analysis background but much prefer the macro trade. Being able to combine both skills and an understanding of my "emotional capital" has helped me in my career.
© 2011 Copyright Tony Pallotta - Disclaimer: The above is a matter of opinion provided for general information purposes only and is not intended as investment advice. Information and analysis above are derived from sources and utilising methods believed to be reliable, but we cannot accept responsibility for any losses you may incur as a result of this analysis. Individuals should consult with their personal financial advisors.
© 2005-2022 http://www.MarketOracle.co.uk - The Market Oracle is a FREE Daily Financial Markets Analysis & Forecasting online publication.


