


Stock Market Oktoberfest: When The Music (Money) Stops Playing (Flowing)…
Stock-Markets / Stock Markets 2011 Oct 31, 2011 - 02:25 AM GMTBy: Willem_Weytjens

 Last week, the markets rallied sharply on news that banks were willing to take a 50% haircut on their Greek Bond holdings.
It was a hell of a party, as many asset classes were joining “Oktoberfest” : Gold, Copper, Silver, Oil, Stocks,…
The party was organized by Merkel and Co:
These kind of stimulus packages are like alcohol for the stock markets . They are fun and they make everything look better than it really is… The only problem is that if you get too much of it (alcohol) in a short time, the next day you will probably have a very bad hangover. The same is true with stock markets: when they rally too much over a too short time frame, the hangover will soon follow.
In an article I posted on September 11th, I wrote the following:
Let’s start off with a chart of the German DAX index. While price makes lower lows, the RSI sets higher lows on a daily basis.
This causes Positive Divergence. If the DAX would rally above the red resistance line, we could easily see 6000+ points on the DAX pretty soon. Most people are expecting a double dip scenario right now. And although we can’t rule out a double dip, it often pays to be a contrarian. We all know by now what happens when everybody expects something to happen. Usually, it doesn’t happen. Combine this potential falling wedge with the positive Divergence, and we have a good cocktail for higher prices. (Click here for the entire article and more charts)
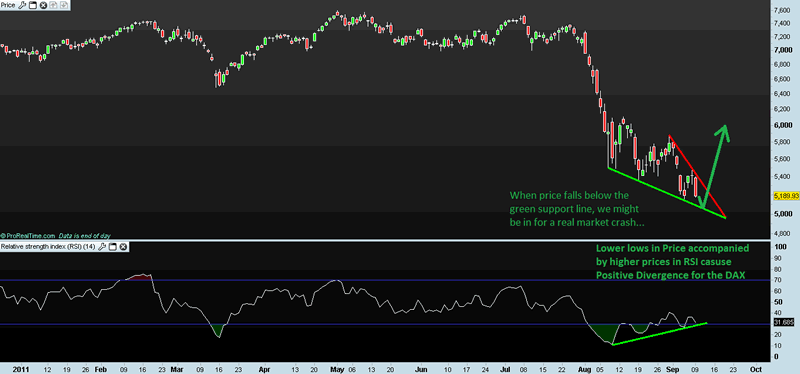
Chart: Prorealtime.com
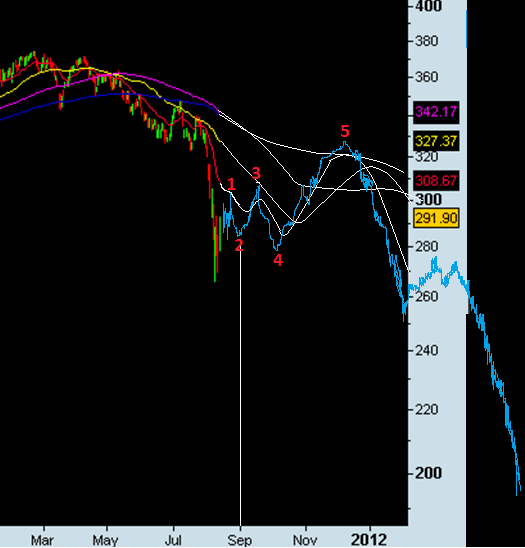
On August 12th, I posted the following chart of the dutch AEX index (for subscribers only) with the blue line being my expectations:
An updated version of this chart was posted on October 24th (for subsribers only):
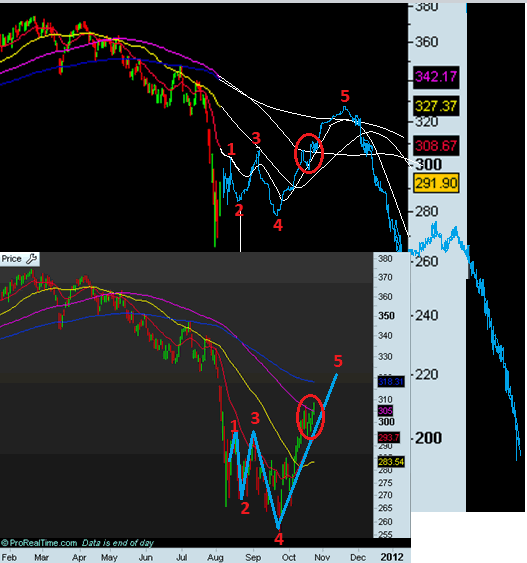
We can see that price (and thus also the Moving Averages) acted almost EXACTLY as forecasted.
Following this sharp rise in stock markets over the past few weeks, prices are looking overbought in the short term, and price has now reached the 200EMA. When we look at the following chart, we can see that this 200EMA has often been an important level during both Bull AND Bear markets. Price was very stretched below the 200EMA a couple of weeks ago, and has tested this level last week. It might rise slightly above this 200EMA in order to attract as many bulls as possible, but so far, it looks like this is just a massive bear market rally (which we forecasted). Potential targets would be 320-335 points for the AEX.
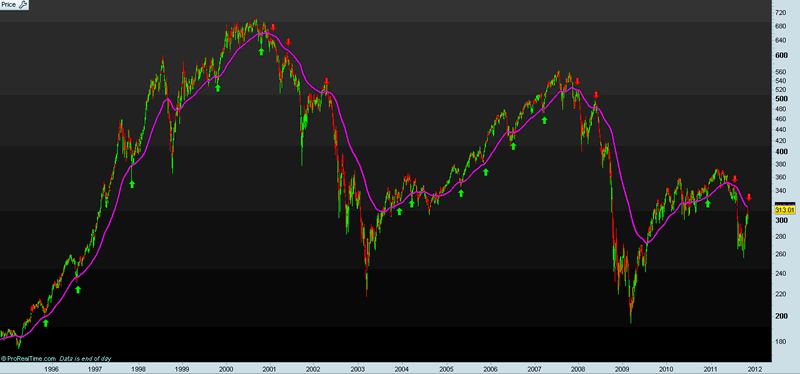
Chart: Prorealtime.com
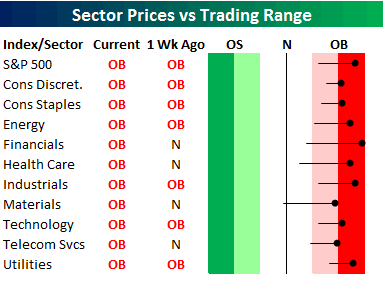
Bespoke Investment Group notes:
The dark red shading in the table below represents between two and three standard deviations above the sector’s 50-day moving average, and moves into this range are considered extremely overbought. As shown, not only are all ten S&P 500 sectors overbought (at least one standard deviation above the 50-day), but 8 out of 10 are in extreme territory. The Financial sector is the most overbought of them all at three standard deviations above its 50-day. The Materials sector is the least overbought at just under two standard deviations above its 50-day.
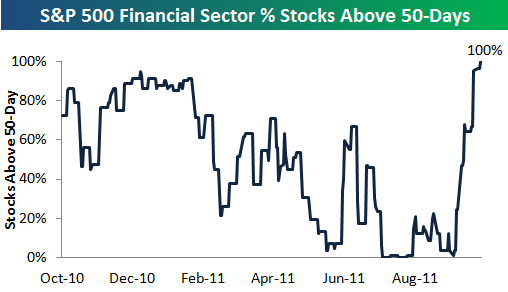
Bespoke also shows that 100% of the stocks in the Financial sector are trading above their respective 50-day moving averages…
The financial stocks rallied big time, so everything is good now? I don’t think so. When we look at the Ted spread (which is the difference between the interest rates on interbank loans and on short-term U.S. Government Debt), we can see that the tensions between the banks are growing, as the TED spread is reaching a 16-month high:
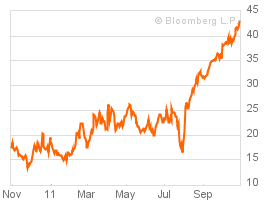
Source: Bloomberg
Gold rallied sharply as well last week, moving away from the green support line in the chart below:
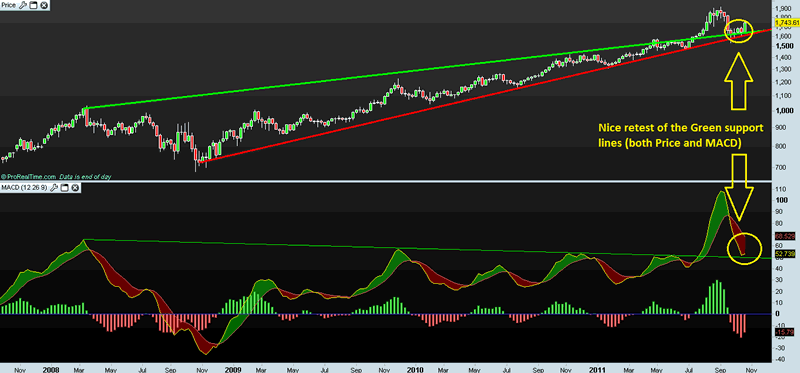
Chart: Prorealtime.com
As a result, the HUI index also rallied substantially.
Although the RSI is not overbought at all, the MACD is very stretched, as shown by the MACD histogram, which shows the distance between the MACD signal lines. Everytime the MACD Histogram was at current levels or higher, the HUI reached an interim top:
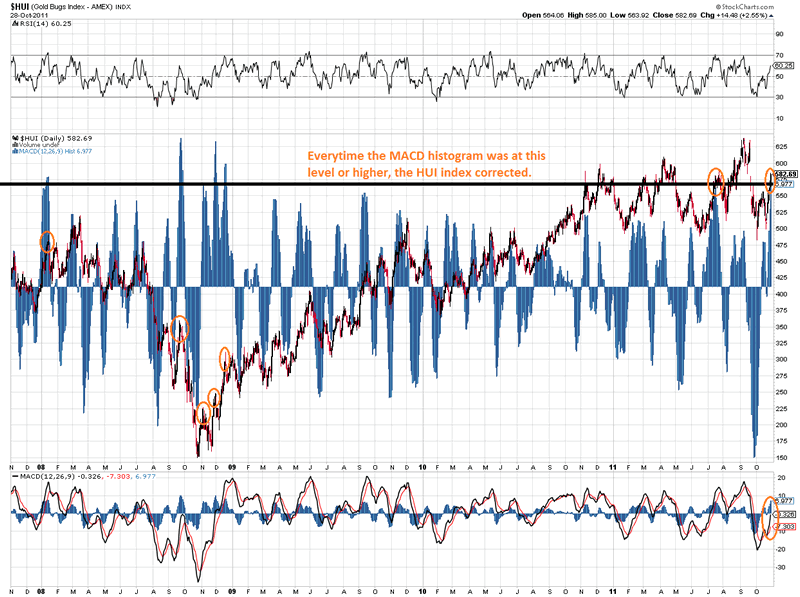
Chart courtesy stockcharts.com
Based on the chart above, we think the Mining stocks need to correct a bit along with the equity markets. However, gold looks set to test the all-time highs, so when/if we get a correction in gold mining stocks, it wil likely be a mild one…
Conclusion: A couple of weeks ago, when everybody was looking for Financial Armageddon, we turned very bullish. Today, everybody is in a party mood, but we are leaving the party. When the music stops playing, everybody will rush for the exits, sometimes causing accidents. It’s better to leave a bit too early and maybe miss the last song of the night (rally), than to leave too late and rush for the exits. There will be plenty of parties over the next couple of years.
One of the biggest parties you have ever seen will last much longer, and we make our way to the (Gold)bars when nobody is ordering… There’s no use to stand in line when everybody wants to have their piece.
We tell our subscribers when they have to make their ways to the (gold)bar. When they are getting too drunk, we tell them to stop drinking and get a sober view and ask themselves what they are doing…
For more analyses and trading updates, please visit www.profitimes.com
Willem Weytjens
www.profitimes.com
© 2011 Copyright Willem Weytjens - All Rights Reserved
Disclaimer: The above is a matter of opinion provided for general information purposes only and is not intended as investment advice. Information and analysis above are derived from sources and utilising methods believed to be reliable, but we cannot accept responsibility for any losses you may incur as a result of this analysis. Individuals should consult with their personal financial advisors.
© 2005-2022 http://www.MarketOracle.co.uk - The Market Oracle is a FREE Daily Financial Markets Analysis & Forecasting online publication.