


Stock Market Volatility Cycle Uncovered
Stock-Markets / Volatility Oct 28, 2011 - 01:09 AM GMT

 In the third quarter of 2011, it has become obvious that many investors, mutual fund and hedge fund managers have ignored the role volatility plays in evaluating market risk. It is possible that they view it, if at all, as a dispersion model, not a harbinger of market direction. That is because rising volatility accompanied rising markets during the entire decade of the 90s, with the exception of the two 4-year market lows in 1994 and 1998. Since then, the relationship between volatility and market direction has changed dramatically. A look at potential cycles in volatility may prove valuable.
(Chart 1 courtesy of www.stockcharts.com)
A look at the last 20 years of Volatility history reveals some startling information. There are only two single-digit lows in the entire 20 year history. The first is the week of December 20, 1993 at 9.31. The second is at the week of December 11, 2006 at 9.39. Unfortunately, StockChart’s historical data for volatility starts in 1992. Chart 2 is the only additional historical information that tracks the Volatility Index before 1992.
The 13-year cycle may have been persistent through longer periods of time than is shown in the charts. Two notable potential 13-year Volatility lows appear in history. The first may have occurred in 1941, just prior to the declaration of World War II, when rising volatility may have added accelerant to a new bull market.
The second probable low may have occurred when Charles Merrill, on April 1, 1928, wrote his famous letter warning his clients to sell their stocks and pay off their debts. Although Mr. Merrill was eventually proven correct, his clients had to wait another 17 months and see an 82% gain in the Dow Jones Industrials before he was vindicated. Could it be that volatility was at a 13-year low and could not provide the accelerant to a downturn for another 17 months?
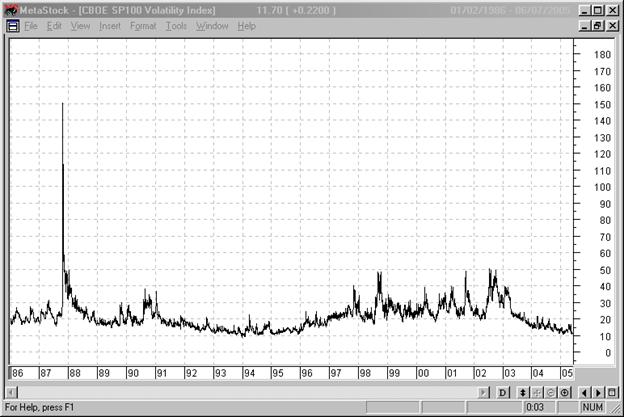
(Chart 2 courtesy of www.chartsrus.com)
Volatility peaks may have accompanied Stock market lows in 1953, 1957, 1962, 1966, 1970, 1974, 1978, and 1982, but there is no direct historical evidence of volatility behavior during that span of time. But it does imply a 4-year cycle in in the equities market that may have a direct correlation to volatility.
The Volatility Index, as we know it began in 1986. Most notably, the first volatility high in October 1987 has not been matched since. We now have historical evidence of volatility peaks marking stock market lows also in 1990, 1994, 1998, 2002, 2006, 2008 and 2010.
The only peak not matching the 4-year cycle (2008) is the also highest since 1987. This may imply the existence of another cycle, possibly a supercycle, that is yet to be identified.
Chart 1 has its cyclical bands set to match the 4-year cycles. The current 4-year cycle mean value (27.17) is plotted on the chart. Since 2000, the Volatility Index has confirmed a change of trend by crossing above or below the cycle mean on the following dates:
- April 2003, when it dropped below the cycle mean at 25.00, starting the next bull market.
- July 2007 when the Volatility index crossed its cycle mean value at 15.00, three months before the next bear market began.
- April 2010 when it crossed its cycle mean at 24.00 to announce the flash crash in May.
- August 2010 when it went below the cycle mean at 25 as QE2 was announced and the market had its best September in 71 years.
- July 2011 when it crossed above its cycle mean at 26.00. A complete history is still not written on this move.
Today the Cycle mean is at 27.17 and the Volatility Index remains above it. We may infer from this data that the market is in potential danger of another stock market melt-down. The 4-year cycle mean has risen higher than it did during the 2002-2003 market lows and it is still rising, suggesting that this is not an ordinary 4-year cycle.
Armed with this information, I offer the words of Charles Merrill in his famous letter to his clients prior to the great stock market crash in 1929, as quoted in his obituary;
"Now is the time to get out of debt. We think you should know that with a few exceptions all the larger companies financed by us today have no funded debt. This is not the result of luck but of carefully considered plans on the part of their managements and ourselves to place these companies in an impregnable position. The advice that we have given important corporations can be followed to advantage by all classes of investors. We do not urge you to sell securities indiscriminately, but we advise you in no uncertain terms that you take advantage of present high prices and put your own financial house in order. We recommend that you sell enough securities to lighten your obligations, or better yet, pay them entirely."
It couldn’t be said any better.
Good Luck and good trading!
Regards,
Tony
Our Investment Advisor Registration is on the Web
We are in the process of updating our website at www.thepracticalinvestor.com to have more information on our services. Log on and click on Advisor Registration to get more details.
If you are a client or wish to become one, please make an appointment to discuss our investment strategies by calling Connie or Tony at (517) 699-1554, ext 10 or 11. Or e-mail us at tpi@thepracticalinvestor.com .
Anthony M. Cherniawski, President and CIO http://www.thepracticalinvestor.com
As a State Registered Investment Advisor, The Practical Investor (TPI) manages private client investment portfolios using a proprietary investment strategy created by Chief Investment Officer Tony Cherniawski. Throughout 2000-01, when many investors felt the pain of double digit market losses, TPI successfully navigated the choppy investment waters, creating a profit for our private investment clients. With a focus on preserving assets and capitalizing on opportunities, TPI clients benefited greatly from the TPI strategies, allowing them to stay on track with their life goals
Disclaimer: The content in this article is written for educational and informational purposes only. There is no offer or recommendation to buy or sell any security and no information contained here should be interpreted or construed as investment advice. Do you own due diligence as the information in this article is the opinion of Anthony M. Cherniawski and subject to change without notice.
Anthony M. Cherniawski Archive |
© 2005-2022 http://www.MarketOracle.co.uk - The Market Oracle is a FREE Daily Financial Markets Analysis & Forecasting online publication.