


Do Bullish Investors Have an Ace in the Hole?
Stock-Markets / Financial Markets 2011 Oct 26, 2011 - 01:50 AM GMTBy: Frank_Holmes

 Right now, there are planes full of travelers heading to Vegas with dreams of striking it rich. These starry-eyed gamblers would greatly improve their odds by learning how to count cards. Yet, as we learned in the movie 21, where six MIT students team with Micky Rosa to become expert card counters and "bring down the house," this highly illegal technique carries dire consequences.
You may not be able to count cards at the blackjack table, but counting historical trends of the stock market and discovering inflection points are not only legal strategies, they are essential to successful investing.
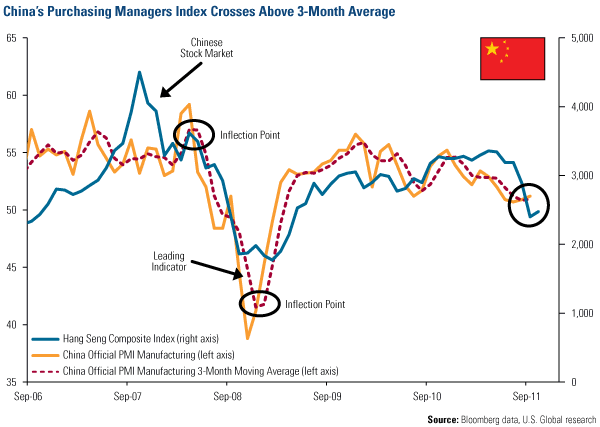
One "card" worth counting is the Purchasing Managers' Index (PMI), which measures the manufacturing strength of any given country. A rising PMI indicates a growing economy and is considered a leading indicator. There are three different types of indicators: coincident, lagging and leading. PMI is considered a leading indicator, meaning its movement historically occurs three to six months before the market reacts.
In China, the PMI just crossed above the three-month moving average. Historically, there's a 67 percent probability that Hong Kong and China stocks, as measured by the Hang Seng Composite Index, will trade higher over the following three months when this happens. As of October 21, the index is up 3.2 percent, and if this historical trend is sustained, we should see continued positive performance.
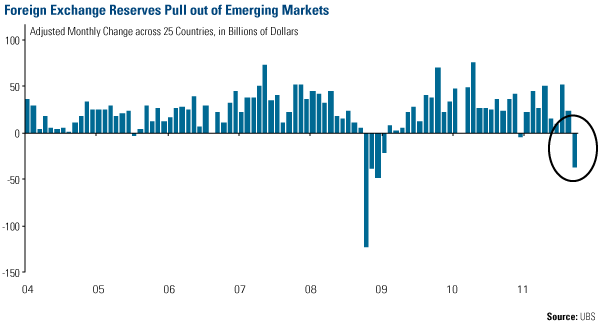
This could be an "ace in the hole" for investors after a dismal September which saw emerging markets decline 17 percent, and U.S. equities fall 7 percent, according to ISI. We also saw the largest amount of money pulled from emerging markets since the fourth quarter of 2008, according to UBS. For the first time in several months, the monthly change in foreign exchange reserves declined double digits.
Three sectors--financials, materials and oil & gas--were primarily responsible for the dismal returns, say Bijal Shah and Stan Shipley from ISI, with emerging markets feeling the brunt of this downturn. That's because the makeup of many emerging market indices primarily consist of these three sectors. In Russia, 88 percent of companies are in these three areas of the market, with 52 percent in the oil & gas industry, 21 percent in materials and 15 percent in the financials industry. Poland, Brazil and Hong Kong all have 70 percent or more of their companies in these three sectors. Only two markets--Mexico and the Czech Republic--have 20 percent or less in financials, materials and oil & gas.
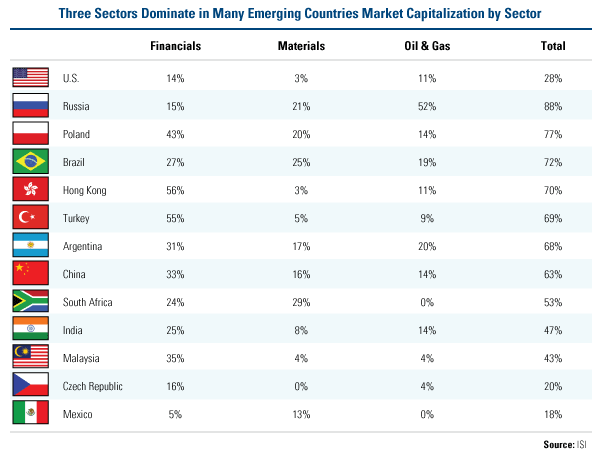
It's a much different story in the U.S. where these three sectors comprise less than a third of the market. As investors shunned these stocks, emerging market countries were punished more severely. Although the ongoing European crisis was the primary driver for exiting equities, ISI notes that emerging market banks have "negligible exposure to Euro area sovereigns." Nonetheless, the banks in these developing countries declined considerably based on the counterparty risk that follows if European countries default on their bonds.
The ongoing crisis in Europe has not only affected emerging markets, it has also negatively influenced the price of many commodities. UBS states that an "escalating bank funding stress in Europe is forcing a profound deleveraging process." As U.S. money markets have been forced to pull their funds out of Europe, the short-term financing markets, which include commercial paper and trade finance, have been stressed and have weakened industrial and commercial credits. Companies involved in the trading and movement of commodities have had to run their businesses for cash, resulting in the disruption of commodity shipments.
This is clearly a negative for commodity prices in the short-term, but we believe the effects have already been priced into the market. Also, UBS indicates that this has pushed commodity inventories to "unsustainably low levels" and once credit conditions improve, demand should increase.
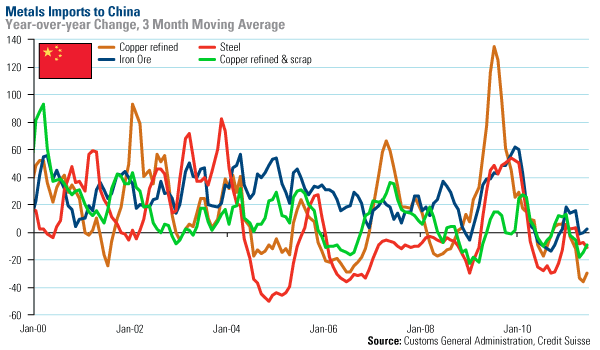
Imports of major metals to China are already running low, says Credit Suisse. While the year-over-year change in iron ore imports is at the same level as last year, copper imports are at an 11-year low, based on its year-over-year percent change.
So, if you're counting the market's cards, you can see that nearly all of the bear market's aces have been played. Now that China's PMI has turned upward, along with the potential for China's monetary policy easing, it's possible we'll see a run in commodities through Chinese New Year.
Want to receive commentary from Frank and analysis from the rest of the U.S. Global Investors team delivered to your inbox every Friday? Sign up to receive our weekly Investor Alert at www.usfunds.com.
By Frank Holmes
CEO and Chief Investment Officer
U.S. Global Investors
U.S. Global Investors, Inc. is an investment management firm specializing in gold, natural resources, emerging markets and global infrastructure opportunities around the world. The company, headquartered in San Antonio, Texas, manages 13 no-load mutual funds in the U.S. Global Investors fund family, as well as funds for international clients.
All opinions expressed and data provided are subject to change without notice. Some of these opinions may not be appropriate to every investor.
Standard deviation is a measure of the dispersion of a set of data from its mean. The more spread apart the data, the higher the deviation. Standard deviation is also known as historical volatility. All opinions expressed and data provided are subject to change without notice. Some of these opinions may not be appropriate to every investor. The S&P 500 Stock Index is a widely recognized capitalization-weighted index of 500 common stock prices in U.S. companies. The NYSE Arca Gold BUGS (Basket of Unhedged Gold Stocks) Index (HUI) is a modified equal dollar weighted index of companies involved in gold mining. The HUI Index was designed to provide significant exposure to near term movements in gold prices by including companies that do not hedge their gold production beyond 1.5 years. The MSCI Emerging Markets Index is a free float-adjusted market capitalization index that is designed to measure equity market performance in the global emerging markets. The U.S. Trade Weighted Dollar Index provides a general indication of the international value of the U.S. dollar.
Frank Holmes Archive |
© 2005-2022 http://www.MarketOracle.co.uk - The Market Oracle is a FREE Daily Financial Markets Analysis & Forecasting online publication.