


October has Killed Another Stocks Bear
Stock-Markets / Stock Markets 2011 Oct 25, 2011 - 01:53 AM GMTBy: Clif_Droke

 October has a tendency to be a "bear killer." That is, in years when the stock market has been in decline heading into October, the month of October more often than not reverses the decline, at least temporarily. In the years that I've been writing a financial newsletter this was true in the following Octobers: 1998, 1999, 2001, 2002 and 2005.
Since the rationale behind the May-September mini-bear market was the economic situation in Europe, let's start with some currency considerations. Since the ongoing rally has been primarily currency driven, it stands to reason that any continued weakness in the dollar and strength in the euro will benefit equities. The previous 20% decline in some major market indices from May to September was largely the psychological result of investor liquidation of stocks over fears relating to the deterioration in the Greek debt situation.
With the upcoming G20 summit the object of financial media focus and with rumors flying everywhere about the nature of the next Greek bailout package, it would be tempting to conclude that the market will turn bearish on the fear and uncertainty. But we've already seen that the market has already discounted the next European bailout to some extent and has shrugged off much of the fear in recent weeks. Indeed, the stock market is looking more stable and, slowly but surely, is internally strengthening (more on this in a minute).
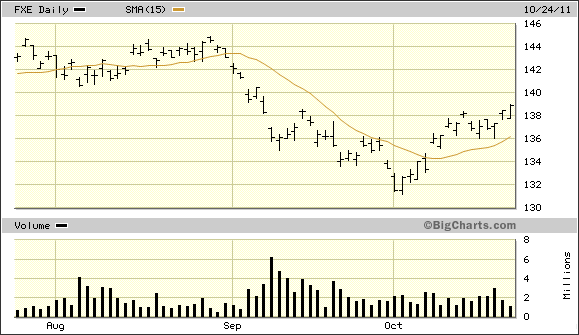
The euro currency ETF (FXE) is an important indicator not only of the health of the euro but is also a leading indicator for the S&P 500 Index (SPX). The FXE was under serious distribution during May-August and this internal selling pressure finally told on the euro and the FXE as both the currency and the ETF dropped precipitously in September (see chart below). Since that time, both the euro and the FXE have bottomed and as you can see in the chart below, FXE has built up a nice little reversal pattern (classical chartists would call it a reverse "head and shoulders" pattern). Moreover, a shift in the external momentum of the FXE is clearly visible in the relationship of price to the rising 15-day moving average. While this pattern isn't what I'd call the makings of a long-term reversal, it should at least be good for a short-term recovery rally and should also enable the euro to keep its head above the water for the next several weeks-to-months while the euro zone debt situation is debated and worked out by officials in Europe.
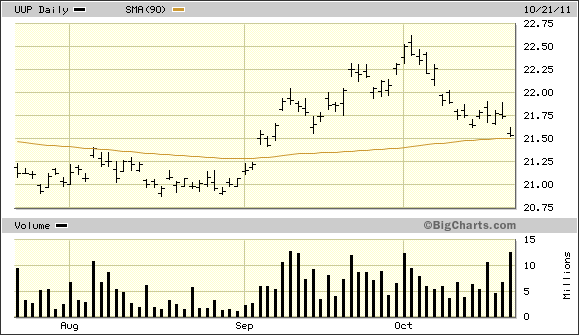
Meanwhile the dollar ETF (UUP) is in a precarious position. The UUP came to rest precisely on top of its dominant interim 90-day moving average on Friday, Oct. 21. This particular moving average has been a valuable turning point indicator for the dollar ETF and has stopped many rallies and declines over the years. This particular trend line is encoded in the algorithms of many high frequency trading (HFT) computer systems and can't be ignored. The significance of the 90-day MA in this case is that if it's broken on the downside, we're likely to witness another heavy selling episode in the dollar. This in turn would be beneficial for stocks and would also mean, inversely, another rally leg for the euro.
The core short-term cycle of 4 weeks evidently bottomed on Thursday, Oct. 20, as evidenced by yesterday's intraday recovery and Friday's breakout above the 10-week trading range ceiling in the SPX. The only weekly cycle of any consequence currently overhanging the stock market is the dominant interim weekly cycle mentioned recently. It's scheduled to bottom on Nov. 4, but as psychologically oversold as the stock market is right now it may not have much impact. The market could just as easily ignore this cycle but we'll continue to respect it just the same, approaching the market one day at a time. For now we're positioned to profit if the market decides to keep rallying, so we don't have to worry about this prospect. Our conservative stop loss strategy should also get us out of the market at something near break-even should the market turn down suddenly in reaction to this cycle.
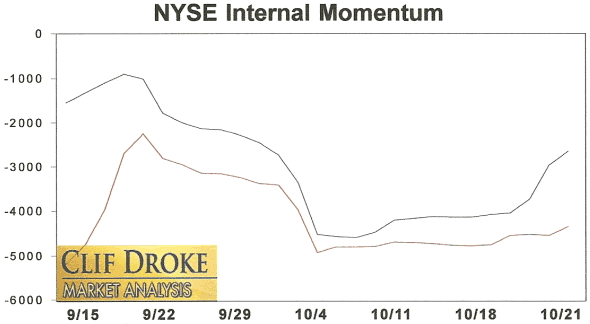
Based on the weight of technical evidence, my best "guesstimate" is that the market recovery will continue. Let's take a look at some of these technical factors. To begin with we can see a steady improvement in the NYSE internal momentum currents, which largely determine the near term direction of stock prices. The most visible improvement is seen in the two most important components of the short-term internal momentum index (HILMO). These indicators are a reflection of the short-term rate of change in the daily 52-week new highs-new lows. The new highs-new lows are what I consider to be the best measurement available of the incremental demand for stocks. As you can see here, the short-term directional indicator (blue line) and the momentum bias indicator (red line) are gradually turning up. This is supportive of stock prices in the near term.
Notwithstanding the internally strengthening position of the broad market, there is one negative near-term factor that must be addressed. This refers to the fact that the 20-day price oscillator for the S&P 500 Index is currently reflecting an extremely "overbought" reading. In fact this is the most overbought the 20-day oscillator has been in the past two years (see chart below).
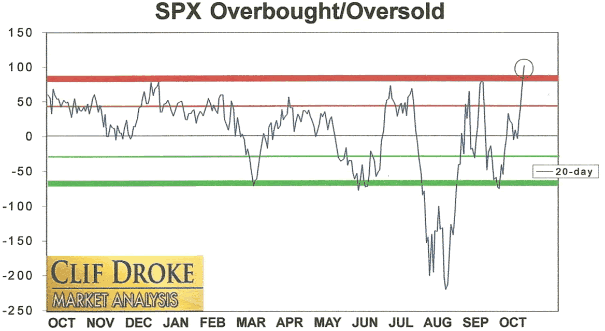
There's always a point in early in a recovery when the oscillators become extremely overbought; it's inevitable based on the rate of change in the price of the S&P 500 as it moves from its correction low to a higher level. In a true recovery phase the market is normally slowed down by an overbought condition and somewhat vulnerable to a pullback. But if this is in fact a recovery as opposed to a "bull trap," the market should be able to hold most of its recent gains in the face of this overbought condition until the market cools off and the 20-day oscillator returns to a healthier position.
Cycles
Over the years I've been asked by many readers what I consider to be the best books on stock market cycles that I can recommend. While there are many excellent works out there on the subject of technical and fundamental analysis, chart reading, etc., precious few have addressed the subject of market cycles. Of the relatively few books on cycles that are available, most don't even merit mentioning. I've read only one book in the genre that I can recommend - The K Wave by David Knox Barker - but even that one doesn't deal directly with stock market cycles but instead with the economic long wave. I'm pleased to announce, however, that after nearly 10 years of research and one year of writing, I've completed a book on the subject that I believe will meet the critical demands of most cycle students. It's entitled, The Stock Market Cycles, and is available for sale at:http://clifdroke.com/books/Stock_Market.html
By Clif Droke
www.clifdroke.com
Clif Droke is the editor of the daily Gold & Silver Stock Report. Published daily since 2002, the report provides forecasts and analysis of the leading gold, silver, uranium and energy stocks from a short-term technical standpoint. He is also the author of numerous books, including 'How to Read Chart Patterns for Greater Profits.' For more information visit www.clifdroke.com
© 2005-2022 http://www.MarketOracle.co.uk - The Market Oracle is a FREE Daily Financial Markets Analysis & Forecasting online publication.