Hyper-inflationary Paper Promises Poised On Precarious Perch
Stock-Markets / Inflation Dec 17, 2007 - 10:18 AM GMTBy: Captain_Hook

 Whether it be due to a global currency crisis , it's effects , or because worse is yet to come , no matter, the ever-growing hyperinflationary mountain of paper promises is precariously perched on the edge of a precipice ready to fall, and in doing so; such an event would accelerate the end of the US Dollar ($) empire, along with its dominance in world affairs and trade . And no amount of fairy tales or interventions will be able to halt the $'s slide from prominence – nothing. This is becoming more evident in the fact the credit crisis is now spreading to Asia , where the stock markets have become destabilized.
How bad could this get? Answer: If what we are witnessing is at a minimum a Grand Super-Cycle Degree event, then a total collapse of stock, bond, and currency markets world-wide could be in store as the globe reverts back to more regionalized economies, and localized currencies . So, one should be increasingly careful in terms of exposures to stocks, brokerage firms, and banks, because a collapse in equities will come at some point, and when it does, it could be a Duesy . The plunge in Novagold (NG:AMEX & TSX) yesterday is a good example of such an occurrence – out of the blue. (More below on NG.)
The following is an excerpt from commentary that originally appeared at Treasure Chests for the benefit of subscribers.
And there are developments in a number of variables we follow to suggest while a layover (respite) in the journey might well be at hand presently, ultimately all round trips return home. Within this group at present we find the Baltic Freight Index (BDI) , Canadian Dollar (C$) , and Chinese stocks , all three seen as key barometers of a healthy global economy, and all having turned down from extremes recently. In terms of US centric factors obviously the story cannot be any better since it's the bust in the credit boom that's causing a chain reaction globally.
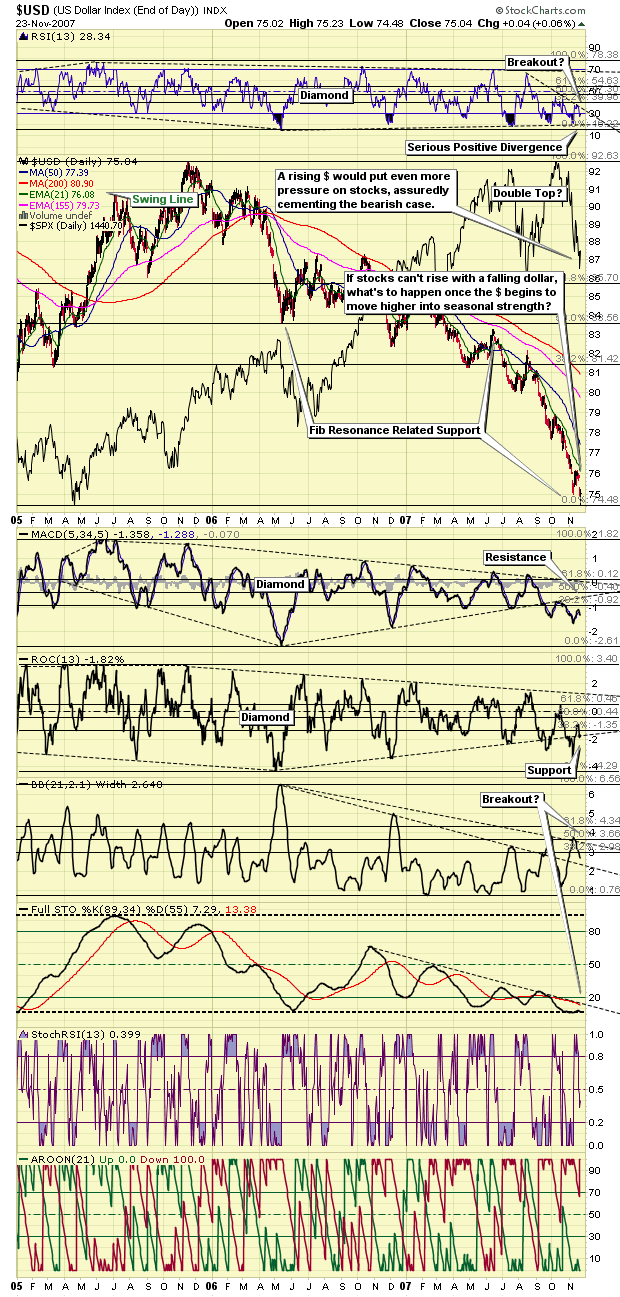
Add to this deteriorating internals in stocks, the prospects of rising price inflation (hitting the tape soon as a result of the falling $), interest rates (bottoming now), and a yield curve that's just biding time before it steepens yet again; accompanied by a rising $ in turn naturally then, and there is good reason to remain pessimistic with respect to equities longer term. Short-term however, it appears we are destined to see a bounce at present, although I don't know how long it will last once the $ starts to rally for real. (See Figure 1)
Figure 1

Have you heard the latest spin on the whole carry trade thingy? Price managers are expecting us to believe speculators are switching from one country to another in financing leveraged bets based on fluctuations in the currencies like they know what they will be. Correspondingly, right now everybody is suppose to be taking on new debt in $'s then, giving us the $ carry trade . Somehow I don't think this concept will be going far, not with the prognosis for bank stocks to continue sliding down the slippery slope post a near-term bounce, along with margin debt set to implode as per historical patterning.
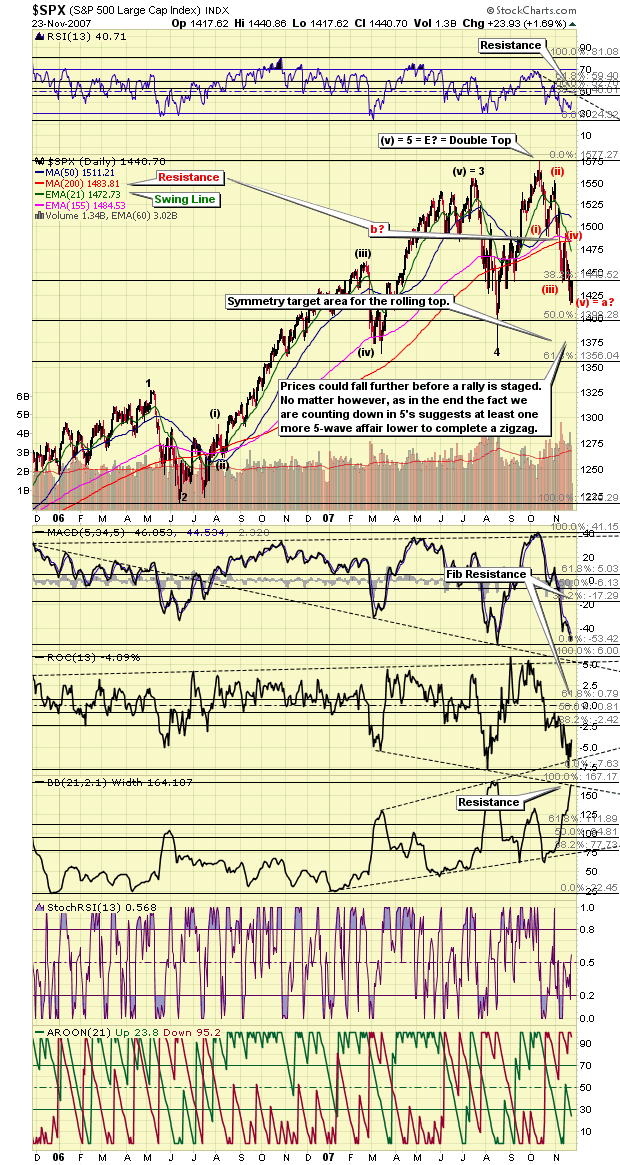
This is why after a short-term bounce into December, I expect stocks to keep falling, where again, if tight historical comparisons are repeated, stocks could fall by 50-percent into spring of 2008. Here is a chart of the anticipated count and patterning unfolding in the S&P 500 (SPX) as I see it, where as prognosticated last week, we are now experiencing what should prove to be a relatively shallow grind higher in the SPX to 1480ish (200-day moving average) as a product of accelerating monetary inflation set against increased short selling along with rising open interest put / call ratios on US stock indices. A short squeeze into seasonal strength and a month end paint job as it were. (See Figure 2)
Figure 2

In this respect traders are buying the dip off the expectation that not only will the Fed pick up monetary growth rates with the Presidential Election next year (and a rate cut on December 11 th ), but also off the expectation (by the bearish) that if this is a repeat to the year 2000 pattern, stocks should rally into March at a minimum. Of course if this is what traders expect, causing short selling and put / call ratios to continue recent declining trends, the hypothesis we will witness a repeat of the post 1937 calendar day top in US stocks (see Figures 1 to 3 ) could very well become a reality. This is why one should be careful about making sure long exposures to equities (even precious metals) past this bounce into December do not exceed risk tolerances.
But hey, what's to worry – right? The Arabs are coming to bail US banks out once again. We have negative real rates . US banks are being institutionalized right into the government, meaning the taxpayer will be footing the bill for the subprime mess. Was there ever any doubt? So the question then begs, ‘what else could possibly go wrong now?' Well, for one thing the swings in the markets are enough to curl one's spine these days, so speculator exhaustion could play a role in curbing interest in speculation. This is a natural considering the aging western populations at this point and will play a big role in curbing the demand for financial assets moving forward as retirees attempt to spend their savings.
In the meantime however, and as mentioned above, speculators are returning to the fold, where what is happening is hedge funds are taking an improving risk profile with respect to the financials to lever up their portfolios once again. This is why index related put / call ratios are rising, where protective puts are being accumulated to offset leveraged cash exposures. So, with positive seasonal considerations on their side, along with a record high supply of retail short sellers positioned to squeeze, expect stocks to head higher soon, where who knows, perhaps prices overshot the 200-day moving average on the SPX. This is a wave 2 affair so up to a 99-percent retrace back up into the mid 1500 is possible, but not probable. Again, in this respect a move back to test the break of the 200-day moving average at 1480 (with possible overshoot to the large round number at 1500) is most probable, where we will be scrutinizing short and put / call ratios at the time to ensure this perspective is maintained.
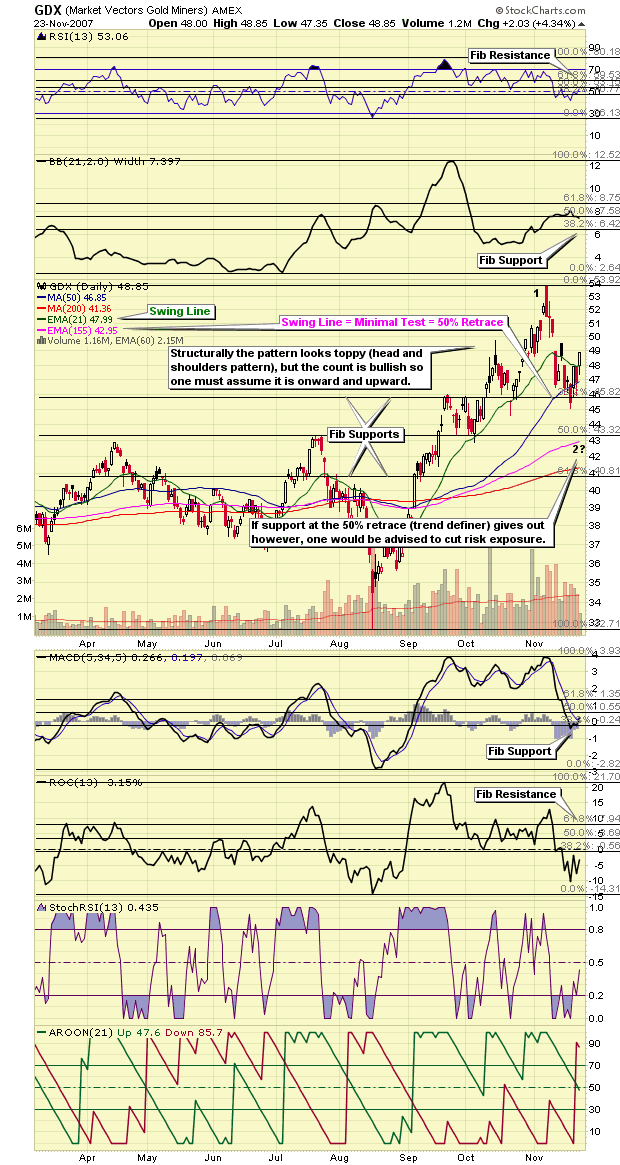
All this means we should also expect a bounce in precious metals prices moving forward as well, but again, if the $ begins a multi-month rally soon, one does need wonder just how strong this move will be. In this respect I do expect both gold and silver (with silver leading while stocks remain buoyant) to begin rising more aggressively across an expanding array of fiat currencies about now due to the growing urge for competitive devaluations a global currency / economic crisis will foster, with the best gains seen while the yen pulls back at present. The yen is now short-term overbought and in need of a multi-week correction that should do precious metals a great deal of good into a seasonal high in December even though this could involve a somewhat stronger $. Of course I could just be imagining things because this picture of the Market Vectors Gold Miners ETF (GDX:AMEX) sure looks toppy. (See Figure 3)
Figure 3

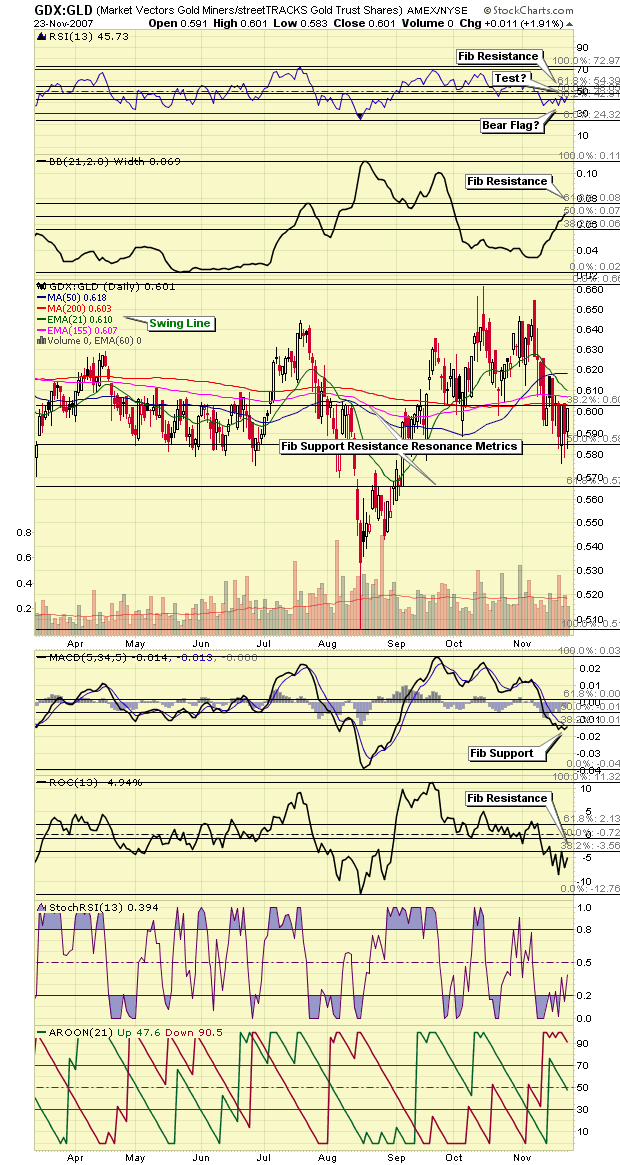
And in putting paper against paper, where it appears all varieties are in need of accelerating inflation to lift prices these days, it should be noted the GDX / streetTRACKS Gold Shares Trust (GLD) Ratio is also looking quite toppy, with values currently well contained below both structural Fibonacci resonance related resistance along with key moving averages, seen below. Structurally, prices have traced out what looks like a head and shoulders pattern. Of course if enough energy is spun-off from improving liquidity conditions in December, this pattern would likely be negated. (See Figure 4)
Figure 4

Unfortunately we cannot carry on past this point, as the remainder of this analysis is reserved for our subscribers. However, if the above is an indication of the type of analysis you are looking for, we invite you to visit our newly improved web site and discover more about how our service can help you in not only this regard, but on higher level aid you in achieving your financial goals. For your information, our newly reconstructed site includes such improvements as automated subscriptions, improvements to trend identifying / professionally annotated charts , to the more detailed quote pages exclusively designed for independent investors who like to stay on top of things. Here, in addition to improving our advisory service, our aim is to also provide a resource center, one where you have access to well presented ‘key' information concerning the markets we cover.
On top of this, and in relation to identifying value based opportunities in the energy, base metals, and precious metals sectors, all of which should benefit handsomely as increasing numbers of investors recognize their present investments are not keeping pace with actual inflation, we are currently covering 68 stocks (and growing) within our portfolios . This is yet another good reason to drop by and check us out.
And if you have any questions, comments, or criticisms regarding the above, please feel free to drop us a line . We very much enjoy hearing from you on these matters.
Good investing all.
By Captain Hook
http://www.treasurechestsinfo.com/
Treasure Chests is a market timing service specializing in value-based position trading in the precious metals and equity markets with an orientation geared to identifying intermediate-term swing trading opportunities. Specific opportunities are identified utilizing a combination of fundamental, technical, and inter-market analysis. This style of investing has proven very successful for wealthy and sophisticated investors, as it reduces risk and enhances returns when the methodology is applied effectively. Those interested in discovering more about how the strategies described above can enhance your wealth should visit our web site at Treasure Chests
Disclaimer: The above is a matter of opinion and is not intended as investment advice. Information and analysis above are derived from sources and utilizing methods believed reliable, but we cannot accept responsibility for any trading losses you may incur as a result of this analysis. Comments within the text should not be construed as specific recommendations to buy or sell securities. Individuals should consult with their broker and personal financial advisors before engaging in any trading activities, as we are not registered brokers or advisors. Certain statements included herein may constitute "forward-looking statements" with the meaning of certain securities legislative measures. Such forward-looking statements involve known and unknown risks, uncertainties and other factors that may cause the actual results, performance or achievements of the above mentioned companies, and / or industry results, to be materially different from any future results, performance or achievements expressed or implied by such forward-looking statements. Do your own due diligence.
Copyright © 2007 treasurechests.info Inc. All rights reserved.
Unless otherwise indicated, all materials on these pages are copyrighted by treasurechests.info Inc. No part of these pages, either text or image may be used for any purpose other than personal use. Therefore, reproduction, modification, storage in a retrieval system or retransmission, in any form or by any means, electronic, mechanical or otherwise, for reasons other than personal use, is strictly prohibited without prior written permission.
Captain Hook Archive |
© 2005-2022 http://www.MarketOracle.co.uk - The Market Oracle is a FREE Daily Financial Markets Analysis & Forecasting online publication.


