


Stock Climb Wall of Worry. It is all about the Dollar Now
Stock-Markets / Stock Markets 2011 Oct 24, 2011 - 12:16 PM GMTBy: Bob_Clark

 The stock markets tend to make a seasonal low at this time, most years. Then rally into the New Year. The big question is, can we climb the wall of worry one more time.

The news is focusing on Europe and the coming bailout of Greece and the banks that funded the profligate ways of the Piigs. The truth is that there is too much debt. Credit availability is too restrictive to growth. A bailout will help keep the game going but it is just a matter of time before a bigger debtor nation goes down. This QE is just a chance for the Fat Boys to steal a little more money. In a couple of years, people will be asking where the money went, like they are starting to do in the USA.
It is all about the Dollar
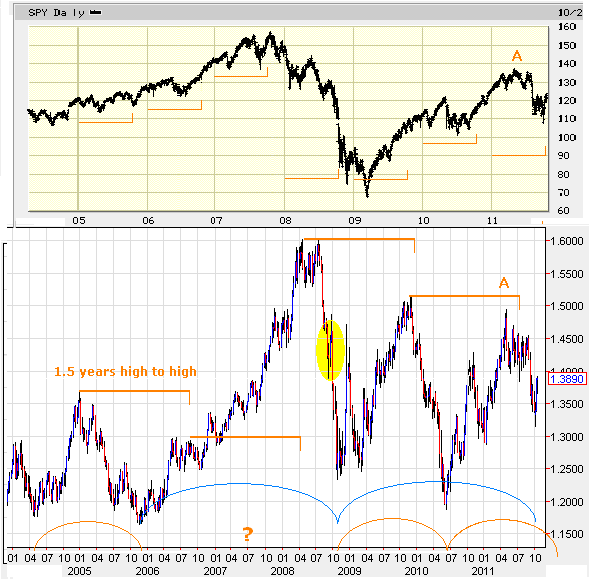
It is interesting to look at the two charts below using a cyclical perspective. I am looking at both the dollar, as inversely represented by the euro and the SPY, which is representing the US stock market.
We notice a strong correlation between the Euro and the SPY. When the dollar is strong and therefore the Euro is weak, we see corresponding weakness in the stock market. Since the top in 2007, or 2008 we have not been able to go to new highs in either market. In other words the dollar has been able to stand its ground against all odds. Now it is the Euro that is supposed to be in peril. Point A which marked the top of the last rally, is still well below where we were four years ago.
There is a four year cycle in the stock market and this year is exactly four years from the last high. In theory that should mark the top in the retracement we have seen, which started in 2009.
Presents from Santa
As traders and investors we want to know if Santa Claus will be coming this year.
I have marked in "you are here" pointers on the SPY chart, so we can see how we did in at this time in previous years. We see that in the last five out of seven years we have rallied into the end of the year.
It looks like we have again started a year end rally. Will it succeed, or clunk like it did in 2008? Maybe we churn like we did in 2007.
Cyclicality
Above I have marked in two cycles on the Euro chart. One is the 3 year cycle (blue arc)and the other is the 1.5 year cycle (orange arc). The 1.5 year cycle, which in theory should be half of the 3 year cycle, tends to be somewhat elastic. Not fitting in exactly with the 3 year but we will extrapolate it using its recent duration, as it tends to be fairly reliable, although it did not fit in 2007. We see that the low it projects is not expected until the new year. That does not bode well for this rally attempt succeeding.
The 3 year cycle on the other hand says the low may have already been made. Is it possible that we are making a V bottom that will see us rally straight back up and go to new highs? Will the bailout of Greece be the catalyst for such a move?
Point A should be marking both the top of the last 3 year cycle and the 1.5 year cycle (orange marker) in the Euro.
In theory, the fact that this 3 year high was lower than the one before, says the some of all trends larger than 3 years is going down. The 3 year low that is expected now, or soon, should be lower then both the last one in 2008 and the half cycle low in 2010.
Since the low in 2010, we have been coiling, or compressing. Unfortunately that can happen in the real world and we may not see a big decline into year end. A compression means the market is very strong and is ignoring the dominating force of the cycles. If it can stand its ground, a big move is coming to the upside.
Simplified, what that means is that we are either at a point such as we saw in 2008, or we have made an important 3 year low and are about to bolt higher. I have marked the 2008 set up with a yellow circle.
Can we buy here safely, or should we wait?
Lets look a little closer for clues.
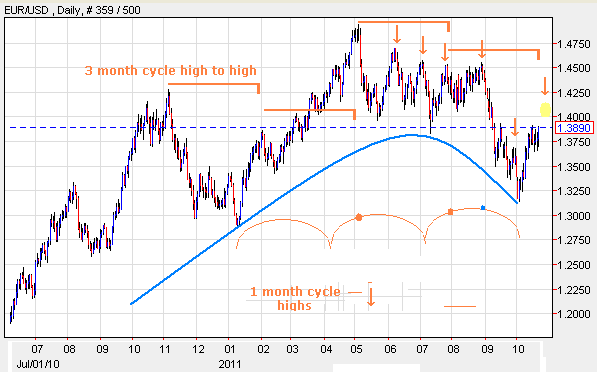
On the chart below we have narrowed the focus by looking at a daily chart of the Euro which makes it easier to see the 1 and 3 month trading cycles. I have marked the 1 month cycle highs with arrows. I am focusing on the highs because the dollar is making lows at these points and they tend to be fairly consistent.
We notice that since we made the 1.5 year high in the Euro and therefore the 1.5 year low in the Dollar, we have been making lower 3 month lows each time. We are approaching the next 1 month cycle high in the Euro and it should coincide with the next expected 3 month high. This is known as nesting. Conversely we are expecting a corresponding low in the Dollar.
When that high is made, it should signal that the upward influence of the rising 3 month and 1 month cycles is over. At that point we should have no cyclical support and we should fall like we did in 2008. A falling field of Euro cycles should equal a strong Dollar. That should cause the stock market to struggle at the very least.
Bottom line
We know that Wall street likes its bonuses. We know they want a year end rally in the stock market. It will not take much to close higher, year over year.
We also know that we have conflicting signals in the Euro/Dollar pair. We may have made the 3 year low, or we can smash down hard into the end of the year. Smashing down would not help Santa shower gifts on the Wall street elite.
The key here is we know what to look for. We expect the downtrend in the Euro to resume this week. If the market is weak, we should not go much higher. The yellow circle should be as high as we get.
We know the downtrend should resume with a vengeance like we saw in 2008. We know the Euro should fall to the the 1.2250 level.
If that does not happen it is very telling. It will mean that we have seen the 3 year low in the euro and the 3 year high in the dollar.
Short term
We can expect at least a nod of the head to the multiple down cycles in the near term.
So aggressive traders will go short the Euro next week. Wednesday may be the high day.
But we have to be vigilant of buying on the subsequent dip and a premature turn back up. That would signal the 3 year cycle has bottomed. A strong year end rally in the stock market would be the result.
It is vital that we understand market structure and know where the big traders will trigger their entries. It gives peace of mind, knowing we have the Fat Boys on our side.
I teach the trigger points that the Fat Boys use for their orders.
The key is to know in advance what should happen at a specific point. If it does, we are on track, if it does not, then we know something is wrong and we step off, or stay out.
Tiny risk, big rewards are the secret to wealth creation.
Technical indicators do not work, neither does fundamental analysis. The Fat Boys use both to trap investors. It gives them the other side of the trade, allowing them to enter positions.
I offer real time, one on one, learn to trade courses. There is also a powerful video set available. Both will get you on the right track trading stocks, metals and Forex. It is the same track the Fat Boys are on.
The Fat Boys control the markets and if you are not with them, then you are a victim.
Bob Clark is a professional trader with over twenty years experience, he also provides real time online trading instruction, publishes a daily email trading advisory and maintains a web blog at www.winningtradingtactics.blogspot.com his email is linesbot@gmail.com.
© 2011 Copyright Bob Clark - All Rights Reserved
Disclaimer: The above is a matter of opinion provided for general information purposes only and is not intended as investment advice. Information and analysis above are derived from sources and utilising methods believed to be reliable, but we cannot accept responsibility for any losses you may incur as a result of this analysis. Individuals should consult with their personal financial advisors
© 2005-2022 http://www.MarketOracle.co.uk - The Market Oracle is a FREE Daily Financial Markets Analysis & Forecasting online publication.