How to Trade Gold and Oil Prices This Coming Week
Commodities / Commodities Trading Oct 24, 2011 - 04:35 AM GMTBy: Chris_Vermeulen
 How To Trade Gold & Oil – The past couple weeks have been tough for most investors. The recent light volume rallies which have taken place in gold, oil and stocks has been generating mixed signals for technical analysts like myself. In order avoid a large draw down on your trading capital you must focus on the long term intraday charts.
What is a long term intraday chart you ask? It is simply a 4 or 8 hour candlestick or bar chart. For example the charts below in this report are 4 hour charts. So each candlestick represents 4 hours.
Why should you use these long term intraday charts instead of say a daily chart? There are four main reasons for this:
- If you used a daily chart then this information would be condensed showing you the daily high, low, open and closing prices. While the 4 hour futures chart shows you large multi intraday chart patterns that most traders would never see… Patterns not seen by the average investor have a higher probability of working in your favour. Also these patterns are much larger than just normal intraday patterns which you see on the 5, 10, or 60 minute charts. Remember the larger the pattern the more potential profit there will be.
- These longer time frames allow us to follow gold, silver, oil and stock indexes around the clock 24/7 using futures contracts. Think about it… regular trading hours from 9:30am – 4pm ET only allows you to see 1/3rd of the price action each day. That means you are only seeing parts of larger patterns while the 24/7 contracts show you ALL Price Action.
- The last reason you must use futures charts is for the volume readings. Futures show real volume levels which can be used for trading. So the volume you see on ETFs will not have the proper volume levels for that specific commodity or index. More times than not it almost the opposite…
- My last reason for trading long term intraday futures charts is because the price of the underlying commodity or index moves true while the ETFs which try to shadow these commodities generate false breakouts and breakdowns on a regular basis. Watch my video about this here: http://www.thetechnicaltraders.com/ETF-trading-videos/TTTOct19Oil/index.html
Let’s take a look at the charts…
Gold Futures Contract – 240 Minute (4 Hour) Chart
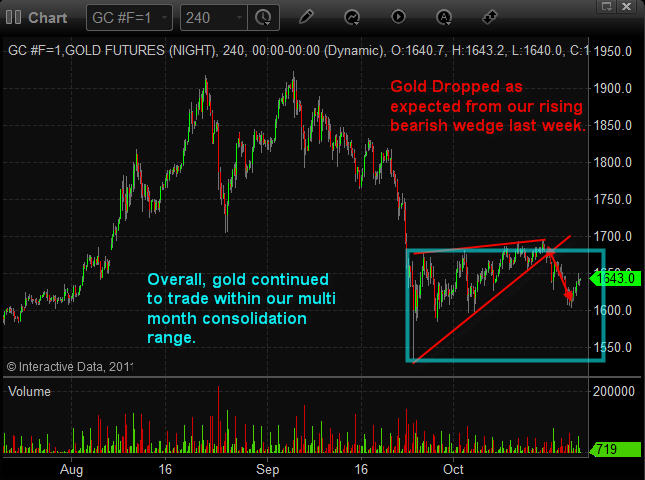
Gold finally broke down from the bearish rising wedge which it had been forming through late September until mid October. I know the majority of traders, investors, and financial newsletters have already positioned themselves either long or short the metal as they anticipate the next major move.
I will agree that a large move either up or down is just around the corner but what sets me apart from others is the fact that I don’t bet my hard earned money when the odds are 50/50. I don’t pick tops or bottoms; rather I wait for a clean break out or low risk entry point. Only then will I take action. Until the blue box on the chart has been broken with some type of retest I will continue to observe and analyze the chart of gold.

Crude Oil Futures Contract – 240 Minute (4 Hour) Chart
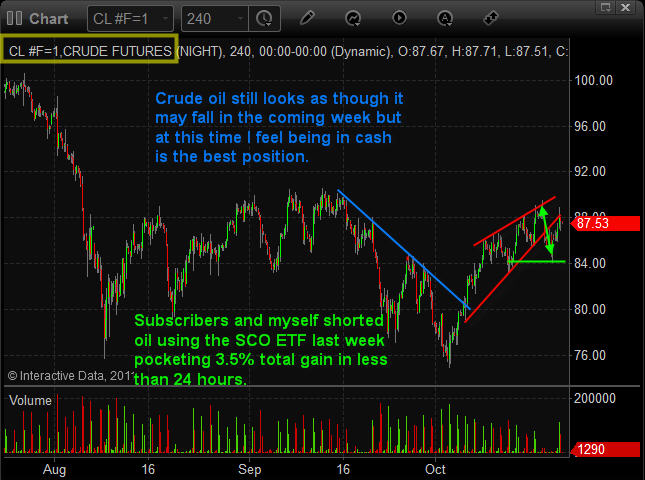
The past month crude oil trading has been very profitable for subscribers and me. We shorted crude oil using an inverse etf in September which moved over 20% in our favour within a few trading sessions. And just last week we shorted it again for a 7.5% move in less than 24 hours.
Overall I am still bearish on oil but have moved to cash until I see another high probability setup unfolding. The recent price action in crude oil makes the odds about a 50/50 bet as to which way it will break next. This is why I have moved back to cash and pocketed the quick gain.

SP500 Exchange Traded Fund – 240 Minute (4 Hour) Chart
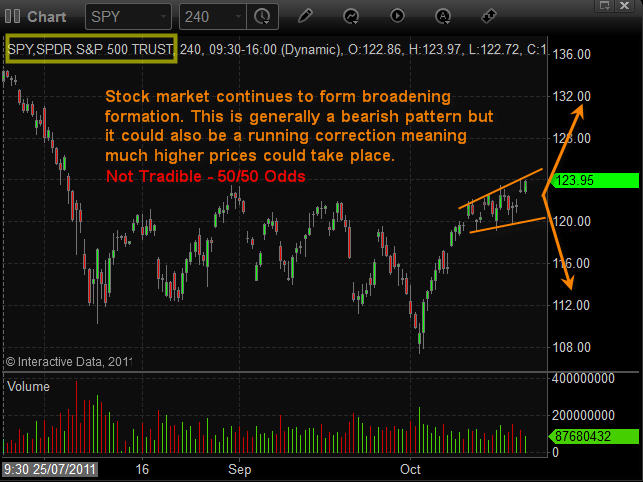
This chart is not the SP500 futures contract. This is just the SPY ETF but what I wanted to show was how the market was showing mixed signals. The past couple weeks price has been broadening and this can be taken two different ways…
More times than not it is seen as a bearish pattern and price generally falls afterwards. But in rare situations which I think we could be experiencing now this broadening price action can be very bullish, meaning much higher prices ahead. So I continue to observe and prepare for a possible trade setup.

Weekend Gold, Oil and Stocks Trend Conclusion:
In short, I feel the market is on the verge of a strong move. The problem is that price action, market sentiment and economic news are all giving mixed signals…
The best position right now is in cash and if something unfolds this week to our favour, then we will get involved but I am not going to take a 50/50 guess on what the next move is until the odds are in favour to one side or the other.
Get my bi-weekly reports and videos by joining my free oil newsletter here: www.GoldAndOilGuy.com
By Chris Vermeulen
Chris@TheGoldAndOilGuy.com
Please visit my website for more information. http://www.TheGoldAndOilGuy.com
Chris Vermeulen is Founder of the popular trading site TheGoldAndOilGuy.com. There he shares his highly successful, low-risk trading method. For 6 years Chris has been a leader in teaching others to skillfully trade in gold, oil, and silver in both bull and bear markets. Subscribers to his service depend on Chris' uniquely consistent investment opportunities that carry exceptionally low risk and high return.
This article is intended solely for information purposes. The opinions are those of the author only. Please conduct further research and consult your financial advisor before making any investment/trading decision. No responsibility can be accepted for losses that may result as a consequence of trading on the basis of this analysis.
© 2005-2022 http://www.MarketOracle.co.uk - The Market Oracle is a FREE Daily Financial Markets Analysis & Forecasting online publication.


