


Gold Price Fundamental Trend Forecast 2012
Commodities / Gold and Silver 2011 Oct 21, 2011 - 04:40 AM GMTBy: Andrew_Butter

 If the fundamental value of gold measured in US-Dollars wasn’t a mystery before; then the past few weeks have added another dimension to the confusion.
Supposedly gold is a “safe haven”, so when the rumors of Armageddon started circulating about the Euro, the price “ought” to have gone up? It didn’t, it went down…by 20%...so much for that theory. Is the latest story that the Euro-refugees figured the 10-Year Treasury was a better bet than gold…even after the downgrade?
So much also for the idea that gold is an inflation hedge, that pretty much went out the window after all of the QE didn’t cause hyper-inflation, but even-so the price of gold, as measured in dollars doubled. Marc Faber says he will keep buying gold until Ben Bernanke stops printing; well Ben appears to be saying that he doesn’t think any more QE will help and it’s time US Congress grew up and started doing their job instead of just milking the cow for their own account, so is Marc still buying?
OK, the idea that gold is somehow driven by the same thing that drives the price of oil (whatever that is) still sort-of holds. Sort-of…at least on that score the spikes in gold prices do appear to follow spikes in oil prices although by that metric the price should be a lot less than now, as in about $1,000 based on historical trend-line correlations between gold prices and oil. There again, the dramatic decoupling of WTI from Brent starting in 2009 is confusing, as in which one should we be tracking now, if either?
Putting aside what’s driving the fundamental it looks like there might have been a bit of a bubble and bust in gold 2008/9 (or a bust and a bubble in the dollar if you are an Austrian), and the recent events look suspiciously like that too?
If those were indeed bubbles-and-busts, then if the bust was fully expressed, one would expect the “fundamental” at the moment of time between the bubble and the bust, to have been somewhere in-between, as in the square-root of the top multiplied by the bottom?
If that’s right we can draw two “fundamentals”, put a line through them, and Voila!!
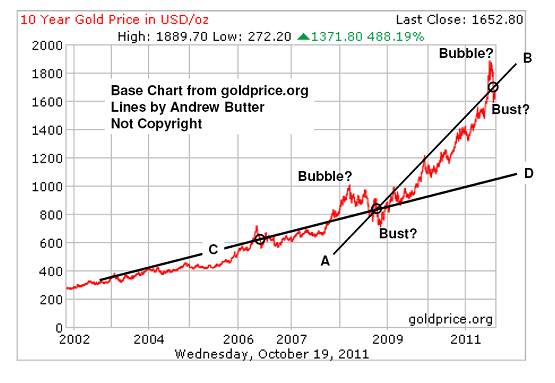
If you buy that logic then the line A-B is the trend, and if indeed “the trend is your friend”, then gold at $1,600 was a wonderful opportunity to exchange some more worthless fiat dollars for some more gold, and then wait contentedly like a fat cat licking milk off your whiskers, for the world to completely disintegrate?
Perhaps….although there are sometimes risks deciding on the direction of a trend from just two points of data. Sure something obviously happened at the start of 2009, and indeed George Soros famously bought gold at that juncture whilst telling everyone it was a bubble; but now according to the reports he has sold, although that may simply be because he liquidated his fund and retired, or perhaps the maestro-bubble-surfer bailed just-in-time?
If so then the line C-D might perhaps express the trend better than A-B, and the “bottom” of $1,600 was in fact, a false-bottom?
That would at least gel with the historical relationship between oil prices (expressed in dollars) and gold prices (expressed in dollars), or if you are an Austrian, oil expressed in ounces of gold.
Does two points of reference trump two points of data?
Going back to the thorny question of the “fundamental”, one irritating thing is that the last time anyone tried really-hard to completely destroy the US (and the world) economy by creating uncontrolled credit, which led up to the stock market crash of 1929, the price of the dollar was pegged to the price of gold (the Austrians would have approved of that), and thus there is no clear precedent for what happens to the “real” price of gold after you drip-feed bankers LSD for an extended period of time.
But perhaps the price of gold in dollars has got something to do with the level of recourse debt that the US government has been piling up; “recourse” as in there is no collateral but the borrowers have the option of trashing your credit score if you don’t pay the money back, or even if you joke that you might not?
Outside of writing IOU’s to the widows and orphans fund, and municipal debt (not counted as government debt in USA but counted in Europe), there are two important measures of US government debt;
(1): The total value of US Treasuries outstanding; those are mainly owned by Americans (or American-based pension funds and insurance companies, and the Fed)…and those are pretty benign because if no-one wants to roll them over you can pay them off simply by printing more dollars.
(2): The total outstanding value of US Treasuries bought by foreigners, mainly so as to finance the current account deficit which is essentially the trade deficit, and in recent years has been largely on account of America buying oil from “aliens” at somewhat unattractive prices (or at least “unattractive” to Daisy). The problem with that sort of debt is if you start printing-to-pay, word gets around so it’s hard to roll it over, and so if there is any suspicion you might do that the aliens might start changing the dollars for something else (gold perhaps), and then you get a run on your currency, and more important, you can’t buy any oil, and so you have to bicycle to work (assuming you got a job).
Putting aside whether or not the price of oil expressed in terms of gold might have anything to do with the pathological aversion of average Americans to walk anywhere except on a treadmill or to go bicycling, or even to take public transport, what happened since gold in dollars was $250 in 2000 was that both those numbers went up dramatically:
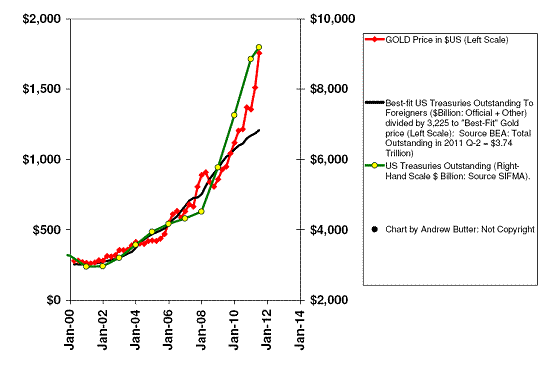
For ten-years up to early 2010 all three lines moved sweetly in tandem with a correlation of over 90%, and then gold and total US Treasuries shot up, but America started to sell less Treasuries to foreigners (mainly because the trade deficit went down so they didn’t need to borrow so much to pay their oil-bill).
So which is the right line? If indeed the cumulative collective incompetence of the US Government, as measured by how far they trash their fiat currency by getting into debt that can only be paid back by printing (as opposed to the traditional approach of collecting taxes)…which is the main driver for the price of gold, then which element of that is the real “fundamental” driver?
If it’s total US Treasuries outstanding then gold is priced correctly now, and line A-B is probably the trend; if not and the real driver is simply America’s dependence on foreigners to borrow money so they can buy oil, then gold looks pricy now, as in a bubble compared to the dollar.
And (now) we all know what happens when reality hits.
Either way the trend-line of US Treasuries outstanding appears to be flattening off, that might be good for America, but it may not be good for gold.By Andrew Butter
Twenty years doing market analysis and valuations for investors in the Middle East, USA, and Europe; currently writing a book about BubbleOmics. Andrew Butter is managing partner of ABMC, an investment advisory firm, based in Dubai ( hbutter@eim.ae ), that he setup in 1999, and is has been involved advising on large scale real estate investments, mainly in Dubai.
© 2011 Copyright Andrew Butter- All Rights Reserved
Disclaimer: The above is a matter of opinion provided for general information purposes only and is not intended as investment advice. Information and analysis above are derived from sources and utilising methods believed to be reliable, but we cannot accept responsibility for any losses you may incur as a result of this analysis. Individuals should consult with their personal financial advisors.
Andrew Butter Archive |
© 2005-2022 http://www.MarketOracle.co.uk - The Market Oracle is a FREE Daily Financial Markets Analysis & Forecasting online publication.