


Stocks Bear Market Rally Faces Numerous Hurdles
Stock-Markets / Stocks Bear Market Oct 21, 2011 - 01:30 AM GMTBy: Chris_Ciovacco

 As we mentioned yesterday, a fear-induced buying climax may occur in the coming days as shorts cover and managers sitting on cash move to the “I can’t take it anymore” stage. While a sustained break above the 1,266 to 1,276 range on the S&P 500 would increase the odds of stocks continuing to march higher, evidence still suggests the current move is a bear market rally that will be fully retraced.
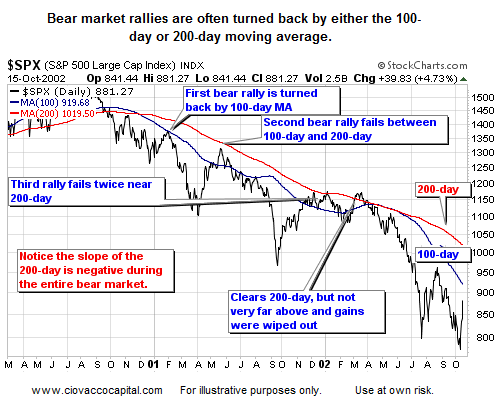
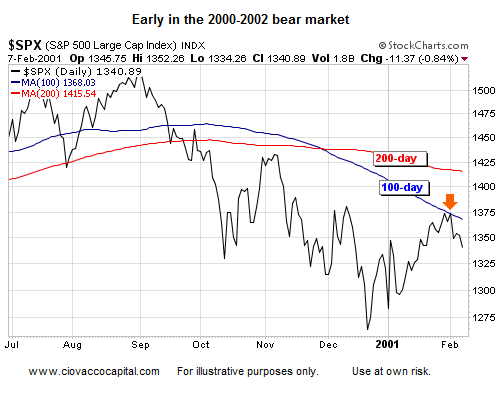
The S&P 500 faces resistance from its 100-day and 200-day moving averages. As shown below in the chart from the 2000-2002 bear market, these levels often bring out sellers. The first bear rally attempt in 2001 was turned back by the 100-day moving average (shown in blue). In 2011, the 100-day current sits at 1,234.
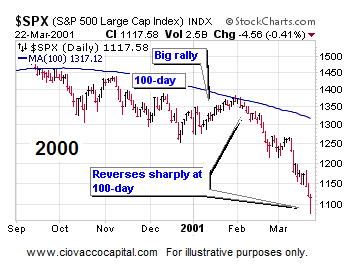
The chart below zooms into the first reversal point shown in the chart above. Notice (a) how quickly the gains from the bear market rally were erased, and (b) covering shorts prematurely or buying before long-term bullish signals surfaced proved to be a mistake (in the 2000-2001 case). We have to keep an open mind about better than expected outcomes if we approach the 100-day or 200-day in the coming days or weeks, but until we see something that does not look like a bear market rally, we will remain patient.
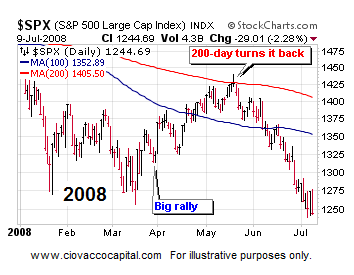
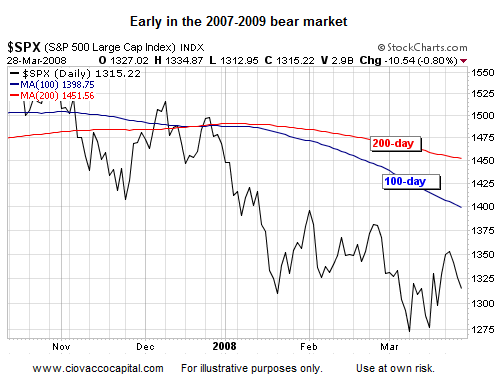
A similar rally to the one we are experiencing today occurred in the spring of 2008. Striking similarities to the 2008 rally shown below remain in place. Consequently, stocks may continue to march higher in 2011. The 2008 rally failed at the 200-day moving average. The 200-day moving average in 2011 sits at 1,275.
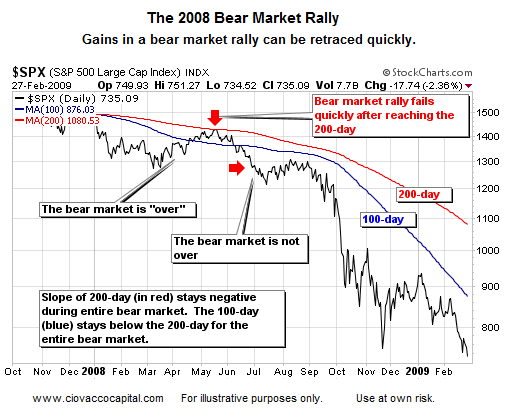
Similar concepts apply: The chart below zooms into the reversal point shown in the chart above. Notice (a) how quickly the gains from the bear market rally were erased, and (b) covering shorts prematurely or buying before long-term bullish signals surfaced proved to be a mistake (in the 2007-2008 case). We will see how things unfold in 2011, but it is important to know common reversal points for strong bear market rallies.
The next three charts show (a) the current S&P 500, (b) the early stages of the 2007-2009 bear market, and (c) the early stages of the 2000-2002 bear market.
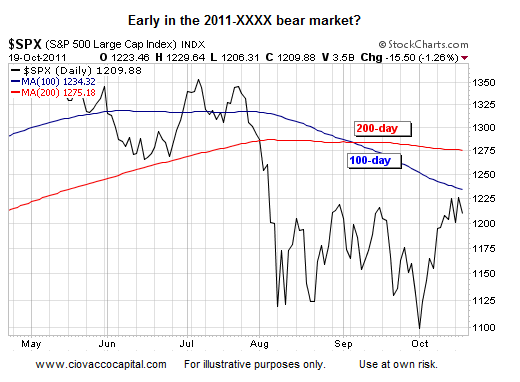
Notice in all three cases (2011, 2008, 2001):
- The slope of the 200-day moving average begins to roll over.
- The 100-day tends to stay below the 200-day.
- Price tends to stay below the 200-day.
Until the present day chart of the S&P 500 improves, the odds continue to favor lower lows, and rallies should be viewed with a healthy dose of skepticism.
While the chart below looks busy and complex, the takeaways are easy to understand. The top portion of the graph shows a measure of market breadth, the percent of S&P 500 stocks above their 200-day moving average. The 200-day is often used as a bull/bear demarcation line. Broad participation in a market move (up or down) tends to confirm the move in the index. Bearish divergences occur on charts when the S&P 500 makes a higher low (see green lines at the bottom of the chart), but the indicator makes a lower low, which indicates an increasing negative bias by investors. In 2006-2007, stocks made a higher low (bottom left) accompanied by a bearish divergence in breadth (top left). The bearish divergence in late 2007 said “be ready for the strong possibility of lower lows in stocks,” which is exactly what happened. A similar bearish divergence occurred between the summer 2010 low and the 2011 lows, which may foreshadow a move to new lows later in 2011 or early in 2012.
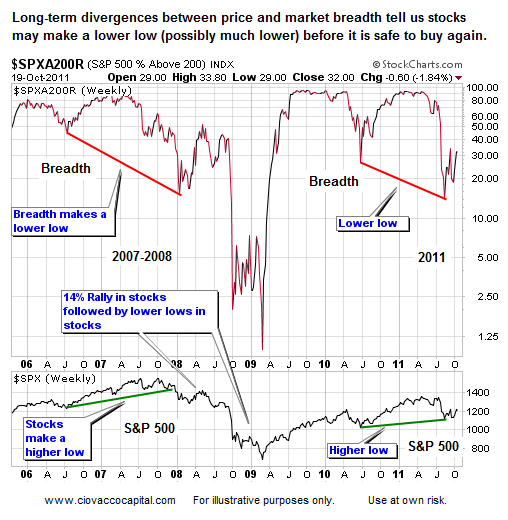
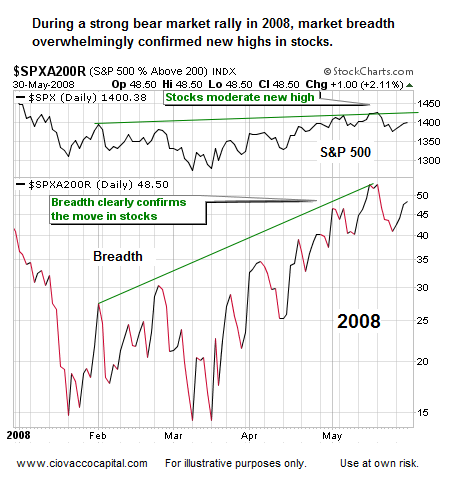
Even if stocks rally further, we believe the outcome will be similar to the spring of 2008 when all the gains were erased in relatively short-order. The bear rally off the March 2008 lows was clearly confirmed by market breadth as stocks and the indicator below both made higher highs.
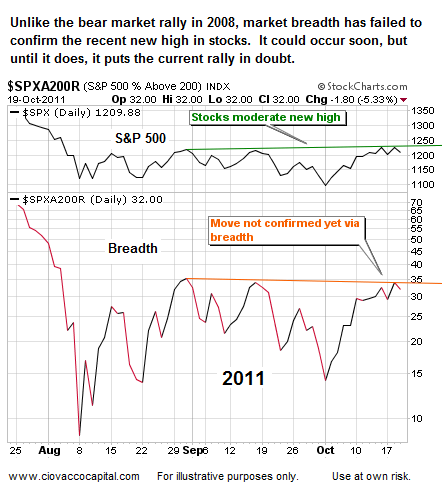
While the 2008 breadth chart above is impressive, breadth in 2011 (below) looks hesitant and unsure. The chart below is not necessarily bearish, but it does show one significant difference between the spring of 2008 and 2011.
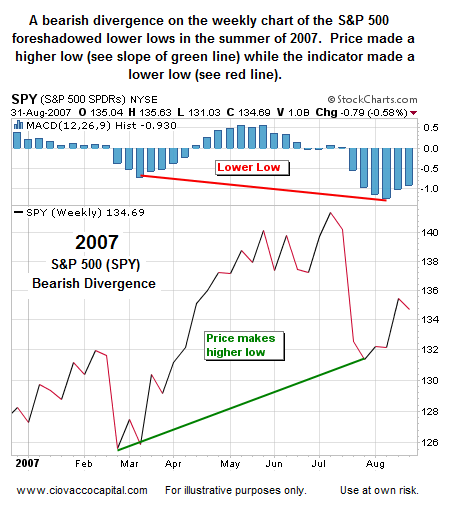
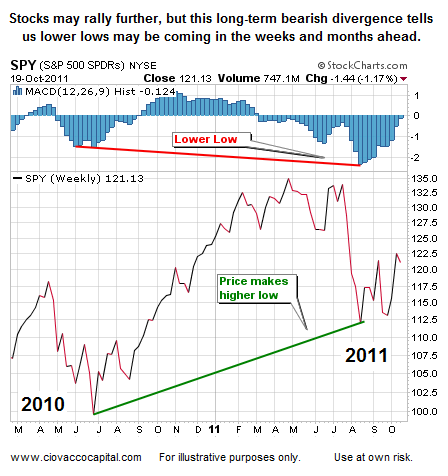
Just as we showed long-term bearish divergences between the S&P 500 and market breadth above, bearish divergences are also clearly evident on the weekly charts.
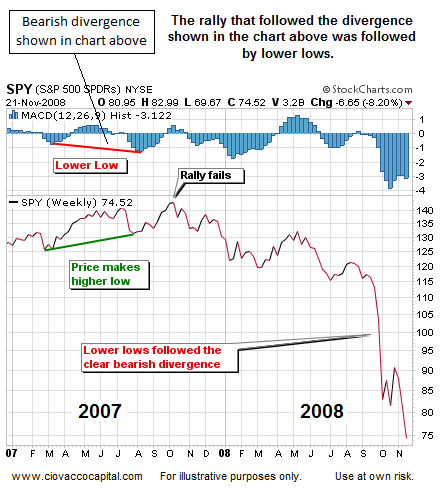
The chart below shows what happened after the divergence shown above; stocks continued to follow the primary trend (down).
A similar and ominous bearish divergence occurred between the summer 2010 lows and recent 2011 lows. This divergence may foreshadow more pain for stock investors in the coming weeks and months. Bearish divergences on a weekly chart need to be respected, as they can be powerful signals. Do all bearish divergences lead to new lows? No, it is possible stocks go on to make higher highs, but it is a lower probability outcome, especially given the current fundamental and technical state of the financial markets.
-
Copyright (C) 2011 Ciovacco Capital Management, LLC All Rights Reserved.
Chris Ciovacco is the Chief Investment Officer for Ciovacco Capital Management, LLC. More on the web at www.ciovaccocapital.com
Ciovacco Capital Management, LLC is an independent money management firm based in Atlanta, Georgia. As a registered investment advisor, CCM helps individual investors, large & small; achieve improved investment results via independent research and globally diversified investment portfolios. Since we are a fee-based firm, our only objective is to help you protect and grow your assets. Our long-term, theme-oriented, buy-and-hold approach allows for portfolio rebalancing from time to time to adjust to new opportunities or changing market conditions. When looking at money managers in Atlanta, take a hard look at CCM.
All material presented herein is believed to be reliable but we cannot attest to its accuracy. Investment recommendations may change and readers are urged to check with their investment counselors and tax advisors before making any investment decisions. Opinions expressed in these reports may change without prior notice. This memorandum is based on information available to the public. No representation is made that it is accurate or complete. This memorandum is not an offer to buy or sell or a solicitation of an offer to buy or sell the securities mentioned. The investments discussed or recommended in this report may be unsuitable for investors depending on their specific investment objectives and financial position. Past performance is not necessarily a guide to future performance. The price or value of the investments to which this report relates, either directly or indirectly, may fall or rise against the interest of investors. All prices and yields contained in this report are subject to change without notice. This information is based on hypothetical assumptions and is intended for illustrative purposes only. THERE ARE NO WARRANTIES, EXPRESSED OR IMPLIED, AS TO ACCURACY, COMPLETENESS, OR RESULTS OBTAINED FROM ANY INFORMATION CONTAINED IN THIS ARTICLE. PAST PERFORMANCE DOES NOT GUARANTEE FUTURE RESULTS.
Chris Ciovacco Archive |
© 2005-2022 http://www.MarketOracle.co.uk - The Market Oracle is a FREE Daily Financial Markets Analysis & Forecasting online publication.