Most Popular
1. It’s a New Macro, the Gold Market Knows It, But Dead Men Walking Do Not (yet)- Gary_Tanashian
2.Stock Market Presidential Election Cycle Seasonal Trend Analysis - Nadeem_Walayat
3. Bitcoin S&P Pattern - Nadeem_Walayat
4.Nvidia Blow Off Top - Flying High like the Phoenix too Close to the Sun - Nadeem_Walayat
4.U.S. financial market’s “Weimar phase” impact to your fiat and digital assets - Raymond_Matison
5. How to Profit from the Global Warming ClImate Change Mega Death Trend - Part1 - Nadeem_Walayat
7.Bitcoin Gravy Train Trend Forecast 2024 - - Nadeem_Walayat
8.The Bond Trade and Interest Rates - Nadeem_Walayat
9.It’s Easy to Scream Stocks Bubble! - Stephen_McBride
10.Fed’s Next Intertest Rate Move might not align with popular consensus - Richard_Mills
Last 7 days
Stocks, Bitcoin, Gold and Silver Markets Brief - 18th Feb 25
Harnessing Market Insights to Drive Financial Success - 18th Feb 25
Stock Market Bubble 2025 - 11th Feb 25
Fed Interest Rate Cut Probability - 11th Feb 25
Global Liquidity Prepares to Fire Bull Market Booster Rockets - 11th Feb 25
Stock Market Sentiment Speaks: A Long-Term Bear Market Is Simply Impossible Today - 11th Feb 25
A Stock Market Chart That’s Out of This World - 11th Feb 25
These Are The Banks The Fed Believes Will Fail - 11th Feb 25
S&P 500: Dangerous Fragility Near Record High - 11th Feb 25
Stocks, Bitcoin and Crypto Markets Get High on Donald Trump Pump - 10th Feb 25
Bitcoin Break Out, MSTR Rocket to the Moon! AI Tech Stocks Earnings Season - 10th Feb 25
Liquidity and Inflation - 10th Feb 25
Gold Stocks Valuation Anomaly - 10th Feb 25
Stocks, Bitcoin and Crypto's Under President Donald Pump - 8th Feb 25
Transition to a New Global Monetary System - 8th Feb 25
Betting On Outliers: Yuri Milner and the Art of the Power Law - 8th Feb 25
President Black Swan Slithers into the Year of the Snake, Chaos Rules! - 2nd Feb 25
Trump's Squid Game America, a Year of Black Swans and Bull Market Pumps - 24th Jan 25
Japan Interest Rate Hike - Black Swan Panic Event Incoming? - 23rd Jan 25
It's Five Nights at Freddy's Again! - 12th Jan 25
Squid Game Stock Market 2025 - 5th Jan 25

Market Oracle FREE Newsletter

How to Protect your Wealth by Investing in AI Tech Stocks

U.S. Dollar Index, The Big Picture

Currencies / US Dollar Oct 20, 2011 - 05:49 AM GMT

By: Colin_Twiggs

Currencies

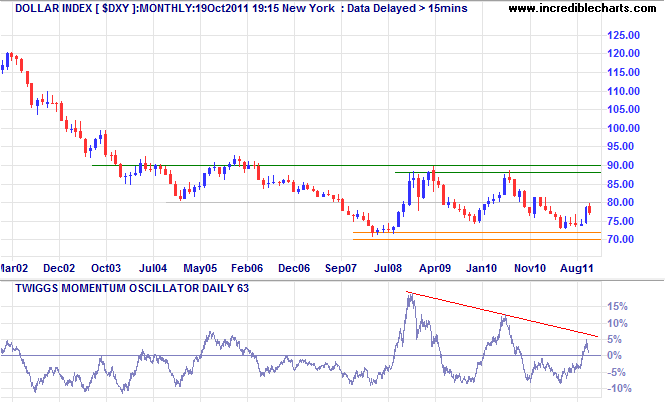
When markets are volatile it often pays to take a step back and look at the big picture. A monthly chart shows the Dollar Index ranging between 70 and 90 since 2003, with the 80 level alternating as mid-range support/resistance. The index recently pulled back from resistance at 80 and will now either re-group for another attempt or medium-term support will give way, signaling a test of long-term support.


Zooming in to the daily chart shows narrow consolidation above medium-term support at 76.50. Breakout above 77.60 and the descending trendline would signal another test of 80, while failure of support at 76 would mean a decline to 73.50*.

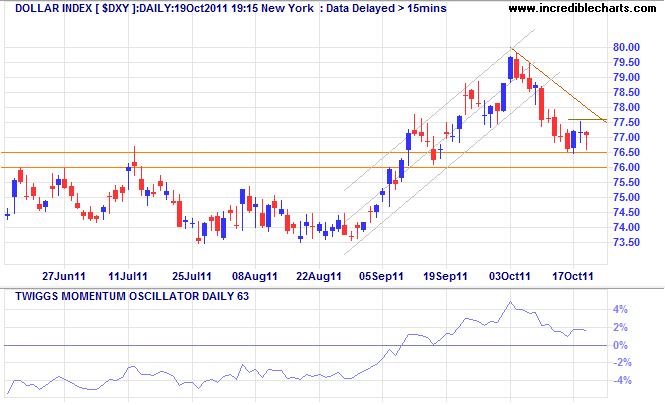
* Target calculation: 76.5 – ( 79.5 – 76.5 ) = 73.5

In the long term, breach of 73.50 would test 70, while breakout above 80 would signal an advance to 90. If support at 70 fails, gold will rocket through $2000/ounce, but that is only likely to occur if the Fed rolls out QE3.

By Colin Twiggs http://www.incrediblecharts.com

Colin Twiggs is the leading commentator at Incredible Charts where he writes the Trading Diary , with more than 70,000 subscribers. His specialty is blending fundamental analysis of the economy with technical analysis of stocks, markets, commodities and currencies. Focusing on the role of the Fed and banking credit as primary drivers of the economic cycle, Colin successfully forecast the October 2007 bear market — eight months ahead of the sub-prime crisis.

These extracts from my trading diary are for educational purposes and should not be interpreted as investment or trading advice. Full terms and conditions can be found at Terms of Use .

© 2008 Copyright Colin Twiggs - All Rights Reserved Disclaimer: The above is a matter of opinion provided for general information purposes only and is not intended as investment advice. Information and analysis above are derived from sources and utilising methods believed to be reliable, but we cannot accept responsibility for any losses you may incur as a result of this analysis. Individuals should consult with their personal financial advisors.


© 2005-2022 http://www.MarketOracle.co.uk - The Market Oracle is a FREE Daily Financial Markets Analysis & Forecasting online publication.


Post Comment

Only logged in users are allowed to post comments. Register/ Log in