


Gold and Silver Stocks Looking Bearish - Traders Don't be Fooled by the End of Day Settlement Prices!
Commodities / Gold & Silver Dec 16, 2007 - 01:18 PM GMTBy: Merv_Burak

Gold ended the week just about where it started but the “feel” of the activity had a decided negative emphasis. Will this week set the pace for the next few months?
Closing Price versus Settlement Price
I have mentioned in the past that I use gold futures to obtain my gold prices used for charts and analysis. I usually use the contract month with the largest trading volume and open interest. When it comes time to change contract months I may go through a little song and dance routine modifying the price to ease into the new price schedule of the new month. This week we had a vivid picture of another feature of futures prices most investors may not be fully aware of. There are really two different “closing” prices. One is referred to as a closing price by the commodities exchange and the other is referred to as a settlement price. I do not consider myself an expert in commodities and futures and have been curious about these two prices. What I found was quite interesting for a technician who likes to have ACTUAL trading prices to work with.
Checking the NYMEX where the COMEX Gold Futures are traded I found their definition of these terms.
Close: A period defined by the Exchange and occurring at the end of each trading session wherein any transactions are considered to be made “at the close”.
Settlement: The price established by the Exchange settlement committee at the close of each trading session as the official price to be used by the clearinghouse in determining net gains and losses, margin requirements, and the next day's price limits. The term “settlement price” is often used as an approximate equivalent to the term “closing price”. ---- In months with significant activity, the settlement price is derived by calculating the weighted average of the prices at which trades were conducted during a brief period at the end of the day.
The best that I can make of this definition, and to redefine it in simple but not necessarily perfectly accurate terms, the closing price is the last trade, while the settlement price is an average of prices during some defined period prior to and including the close.
I have not done an exhaustive investigation but what I did do leads me to believe that the “closing price” that is provided by data vendors or available on various internet web sites are actually the “settlement price”. This was made very clear on Tuesday. The trading action leading up to the close was very volatile with the price plunging very rapidly into the close. The “closing” price on the NYMEX was $802 while the “settlement” price was $817. Most data vendors would have provided traders and investors with the $817 as a closing price, up over $3 on the day rather than the closing price of $802, down $12 on the day. I wonder how many short term traders were surprised with the next day's open at $804.50?
What does all this mean? It's just to emphasize that one should understand what the numbers are that one may be using in their charts. In general these two prices are very much in sync with each other but on volatile days, especially if prices are moving rapidly near the close, one should understand the prices before acting.
GOLD : LONG TERM
From a long term perspective the recent action in gold may be viewed, up to this point, as a lateral action. The long term P&F chart has not added any new activity for a couple of weeks. This past week's activity remains comfortably above the long term moving average line. The momentum indicator is also comfortably above its neutral line. However, the indicator is moving lower and is below recent values as a show of weakness in the price activity. For now the long term rating remains as BULLISH .
INTERMEDIATE TERM
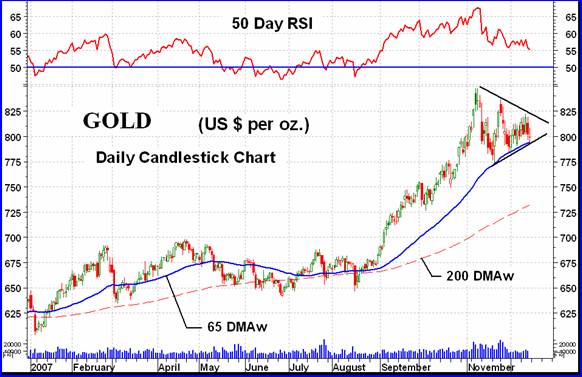
Everything is still bullish from the intermediate term stand point. The Index is still above its intermediate term moving average line. The momentum indicator is still in its positive zone. Here, however, the momentum weakening is very noticeable as the latest momentum value has noticeably declined into new lows since topping out in early November. The volume indicator, after taking a sharp plunge a few weeks ago, has now turned into a lateral move to go with the Index. Although the Index is not yet bearish there are enough indications that all is not that great. I will continue with my NEUTRAL rating for another week. A break through that megaphone pattern should give us the indication of trend, up or down. The Index should break through the megaphone or else the later break will be very weak. Breaks from these patterns usually occur at about the 2/3 point. Any further towards the apex and the break becomes weaker and weaker. Odds of a whip-saw effect then become greater.
SHORT TERM
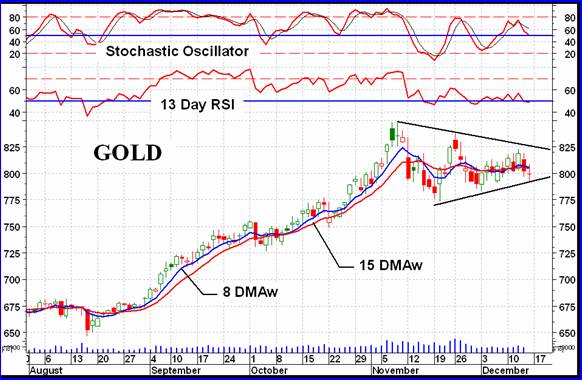
Using the closing price gold had an up, down, up, down, down week. Using the settlement price as the closing price we had an up, up, up, down, down week. The two different scenarios would have provided very different short term and aggressive indicators. The chart here has the closing, closing prices.
The Friday's action just touched the lower support line of the megaphone. It has not broken through and it's still anyone's guess as to which way it will break through. The two short term moving average lines are congested within a very small space while the price continues to bounce above and below the lines. The short term momentum indicator is also not giving us any help here. It too is bouncing above and just below its neutral line. The Stochastic Oscillator is moving lower and has just inched its way below its neutral line. All in all I will continue to wait for the break through the megaphone lines before deciding the next short term direction.
NORTH AMERICAN GOLD INDICES
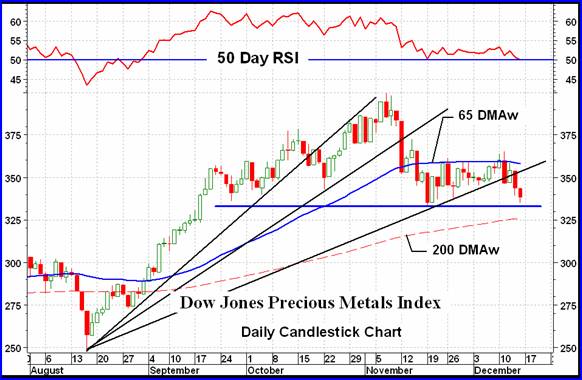
This week's major Index is the Dow Jones Precious Metals Index. It is not too well known but is a major Index. We see here a head and shoulder pattern that is made more valid by its negative divergence at the head location. We also have a bearish decelerating FAN Principle in play. All three FAN trend lines have been breached which suggests an intermediate term bear market in progress. It also suggests that the H&S neckline will be breached validating the pattern and bear trend. A breach of the neckline would project the Index back almost to the August low. Although the Index is still slightly above its previous mid-November low the intermediate term momentum has just slipped under its previous low and below its neutral line. Nothing here to give much encouragement about a possible turn around into new upside highs.
MERV'S PRECIOUS METALS INDICES
Some may wonder why I maintain a Precious Metals Indices Table. Isn't one Index good enough?
Unfortunately, the widely followed Indices are flawed by concentrating their Index value calculation on only the largest companies in the Index. The smaller companies in their Indices usually have very little effect on the Index value. In addition, not everyone is interested in investing/speculating in the largest companies. Many are more interested in the mid to smaller companies where the action is. But the major popular Indices do not tell them what THESE companies are doing. So, I have developed a series of Indices that gives one an idea as to how different “quality” gold and silver stocks are doing and in the process an overall Index that attempts to understand what the whole universe of gold and silver stocks (quality and speculative) are doing.
The Table of Technical Information and Ratings is one way of keeping track of these various Indices and in understanding which Index is doing what, and where the action is. There is a basic concept in market analysis. At the start of any new major bull market the “quality” stocks will move first. After the bull trend has been established then the more speculative stocks start to move. In the gold and silver sector, this secondary move then far exceeds the moves of the “quality” issues even though the quality had a head start. On the down side at the start of a new major bear market it is the speculative stocks that top out first with the quality topping out later.
This concept does not ALWAYS occur but it does often enough that one would be advised to understand the extra potential risks in going against the concept. As an aside, some time back I showed the results of a survey I did to see how the various quality stocks did during major bull and bear markets. Where the more speculative stocks, on average, gained several times that gained by the quality in bull markets while the opposite was not true. Both quality and speculatives declined equally, percentage wise, in bear markets. THINK ABOUT THAT.
If one looks at the major North American Indices in the table one will find a similar performance from each Index. Here, one is correct in thinking that one Index should be enough, after all they are all telling the same story. However, looking at the different Merv's Indices one can see different stories about the market action. Here we see, in general, different performances from the different quality groups. Maintaining the Indices Table gives one a running picture as to what is happening in these different quality sectors.
MERV'S GOLD & SILVER 160 INDEX
The average decline of the five major North American Indices that I look at in rotation here each week was 5%, almost the same as the Merv's Qual-Gold Index. However, the overall universe of gold and silver stocks declined only 2.3%. The overall universe is still acting better than the quality, at least for this week. One might assume from this that the quality stocks are taking their lumps because they were the bigger movers leading up to this point and this is only a normal reaction during a major bull market. One might think that but it is wiser to keep on one's toes and not get too complacent. Surprises always have a way of interfering with one's dreams.
In these commentaries I not only look at the Index value performance but also at the “breadth” of that performance. The breadth is seen in two pieces of technical information, taken from the individual tables of the various Merv's Indices. One of the breadth indicators is the number of Index component stocks that closed higher and the number that closed lower, during the week. This tells us if the Index value was influenced by major moves in a few stocks or if the weekly Index move was general throughout the Index. The other indicator is a summation of individual stock ratings for each time period. This tells us if more Index component stocks are in a bullish or bearish mode and to what extent. I only mention the major mode here although the tables provide both percentage information, bull and bear percentage.
For the overall universe of 160 stocks there were 41 winners (26%), 115 losers (72%) and 4 that remained unchanged. The overall weekly move seemed to be general throughout the universe, by almost a 2 to 1 factor, however, the percentage losses must have been small to only move the Index 2.3% lower. As for where the universe stands in terms of the summation of individual stock ratings, for the short term the universe is in a very bearish mode with a BEAR 80% rating. On the intermediate term the mode is similar with a BEAR 77% rating. On the long term the summation dropped from a bullish mode to a NEUTRAL mode where neither bull nor bear has over 50%. The general drift in market sentiment or breadth seems to be towards the bearish side.
Finally, looking at the charts and indicators, the Index is below a negatively sloping intermediate term moving average line and the intermediate term momentum is in its negative zone, pointing lower. On the intermediate term I can only rate the Index as BEARISH .
On the long term the Index is also below its negatively sloping moving average line. The momentum indicator is still very, very slightly in the positive zone but pointing sharply lower. Here too, I can only rate the Index as BEARISH , at this time.
MERV'S QUAL-GOLD INDEX : MERV'S SPEC-GOLD INDEX : MERV'S GAMB-GOLD INDEX
These are the three quality sector Indices covering everything from the highest quality to the real gambling variety of stocks. Here we see if there is a difference in performance between the various quality and if so what that difference is. Although all of the three Indices were lower on the week the degree of negativity was inverse to their quality. The Qual-Gold Index declined 5.4%, the Spec-Gold declined 4.0% and the Gamb-Gold declined 0.3%. The weekly advancing and declining statistics followed this same path. The Qual-Gold had only one winner (3%) but 29 losers (97%). The Spec-Gold had 8 winners (27%) and 22 losers (73%). The Gamb-Gold had 9 winners (30%) and 19 losers (63%). As for the summation of individual stock ratings, they looked like this:
Qual-Gold: Short term BEAR 92%, intermediate term BEAR 78%, long term BULL 58%.
Spec-Gold: Short term BEAR 73%, intermediate term BEAR 87%, long term BEAR 67%.
Gamb-Gold: Short term BEAR 75%, intermediate term BEAR 65%, long term BULL 80%.
As for the charts and indicators, they agree with all of the information and ratings in the table except for the Qual-Gold long term info. Here the difference is in the slightly more aggressive moving average used in the table program for the long term resulting in the Index moving below the moving average line while my chart analysis still has the Index slightly above the less aggressive line. The chart rating for the long term is therefore BULLISH while the table shows a –N rating, which is just above a full bearish rating.
SILVER
As often mentioned, although my other Indices are a combination of gold and silver stocks I had many requests for a separate silver Index. The results were two Indices. One, with only 10 stocks, included only the largest silver stocks for a “quality” Index. The other, with 25 stocks, included a combination of secondary and gambling variety of stocks for a “speculative” Index.
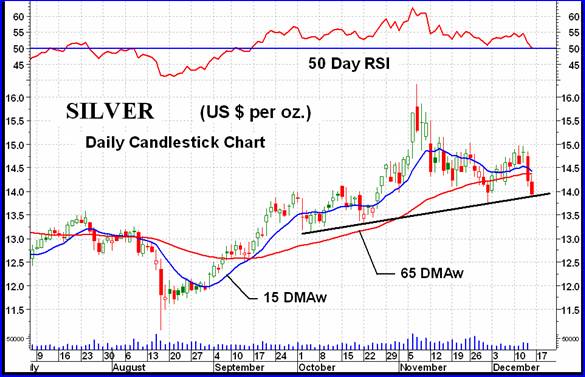
Silver bullion has been performing relatively weaker than gold for some time now, as reflected in its lower Relative Strength (RS) ratings for all time periods in the Table. The intermediate term momentum indicators is sitting right on top of its neutral line, ready to drop into its negative zone, unlike the indicator for gold which is still some distance above its neutral line. Silver closed the week below both its short and intermediate term moving average lines and both lines are sloping downward. Nothing good to say for the direction of silver at this time. One extra point, on the chart we can see an upward sloping head and shoulder pattern. Should the price break decisively below the neckline (the trend line) that would suggest a move back to the lows set in August.
MERV'S QUAL-SILVER INDEX : MERV'S SPEC-SILVER INDEX
The quality silver stocks were hard hit this past week. The Qual-Silver Index lost 8.5%, the largest loss of the Indices in the Table. The Spec-Silver Index lost only 2.5% by comparison. All 10 Qual-Silver stocks declined during the week while we had 6 winners (24%) and 18 losers (72%) in the Spec-Silver Index. As for the summation of individual stock ratings, they were as follows:
Qual-Silver: Long term BULL 50%, Intermediate term BEAR 60%, short term BEAR 80%.
Spec-Silver: Long term BEAR 58%, intermediate term BEAR 80%, short term BEAR 80%.
As for the charts and indicators, they agree with the information in the Table. The intermediate and long term ratings are BEARISH except for the long term Qual-Silver which has a BULLISH rating.
IT'S CHRISTMAS TIME
I will be taking next week-end off to prepare for Christmas. The next commentary will be for the week ending Dec 28 and will be an end of year edition. I'm not yet sure what that will entail but I've got two weeks to think about it.
Here's wishing all a VERY MERRY CHRISTMAS .
Merv's Precious Metals Indices Table
Well, that's it for another week.
By Merv Burak, CMT
Hudson Aero/Systems Inc.
Technical Information Group
for Merv's Precious Metals Central
Web: www.themarkettraders.com
e-mail: merv@themarkettraders.com
Before you invest, Always check your market timing with a Qualified Professional Market Technician
For DAILY Uranium stock commentary and WEEKLY Uranium market update check out my new Technically Uranium with Merv blog at www.techuranium.blogspot.com .
During the day Merv practices his engineering profession as a Consulting Aerospace Engineer. Once the sun goes down and night descends upon the earth Merv dons his other hat as a Chartered Market Technician ( CMT ) and tries to decipher what's going on in the securities markets. As an underground surveyor in the gold mines of Canada 's Northwest Territories in his youth, Merv has a soft spot for the gold industry and has developed several Gold Indices reflecting different aspects of the industry. As a basically lazy individual Merv's driving focus is to KEEP IT SIMPLE .
To find out more about Merv's various Gold Indices and component stocks, please visit www.themarkettraders.com and click on Merv's Precious Metals Central . There you will find samples of the Indices and their component stocks plus other publications of interest to gold investors. While at the themarkettraders.com web site please take the time to check out the Energy Central site and the various Merv's Energy Tables for the most comprehensive survey of energy stocks on the internet. Before you invest, Always check your market timing with a Qualified Professional Market Technician
Merv Burak Archive |
© 2005-2022 http://www.MarketOracle.co.uk - The Market Oracle is a FREE Daily Financial Markets Analysis & Forecasting online publication.