


U.S. Economy Operating in Midst of a Long-term Slump, Depression
Economics / Great Depression II Oct 18, 2011 - 08:47 AM GMTBy: John_Mauldin

 Dr. Lacy Hunt and Van Hoisington of Hoisington Investment Management write a "Quarterly Review and Outlook" that is a must-read for me. This quarter they focus on US monetary policy, noting that "After peaking at 1.69 in the second quarter of 2010, M2 velocity declined for four consecutive quarters, and we estimate that a major contraction in velocity to 1.59 is likely for the third quarter." (I mentioned the importance of the velocity of money in judging inflation vs. deflation prospects in this week's e-letter, too.)
They say, "If our analysis of a new contraction in GDP is correct, the U.S. economy should be viewed as operating in the midst of a long-term slump, regardless of terminology."
They borrow a riff from Harvard economic historian Niall Ferguson, who has asserted that the world is experiencing a "slight depression"; and mention that this conclusion has been backed up by Gluskin Sheff's notable economist, David Rosenberg, who reminds us that "Depressions are basically long recessions lasting three to seven years."
Hoisington Investment Management Company ( www.hoisingtonmgt.com) is a registered investment advisor specializing in fixed-income portfolios for large institutional clients. Located in Austin, Texas, the firm has over $4 billion under management, composed of corporate and public funds, foundations, endowments, Taft-Hartley funds, and insurance companies.
Your kicking up my heels in the Big Apple analyst,
John Mauldin, Editor
Outside the Box
JohnMauldin@2000wave.com
Quarterly Review and Outlook
Third Quarter 2011
Dr. Lacy Hunt and Van Hoisington
Hoisington Investment Management Company, 6836 Bee Caves Rd. B2 S100, Austin, TX 78746 (512) 327-7200 www.Hoisington.com
Downturn
Negative economic growth will probably be registered in the U.S. during the fourth quarter of 2011, and in subsequent quarters in 2012. Though partially caused by monetary and fiscal actions and excessive indebtedness, this contraction has been further aggravated by three current cyclical developments: a) declining productivity, b) elevated inventory investment, and c) contracting real wage income.
a) productivity
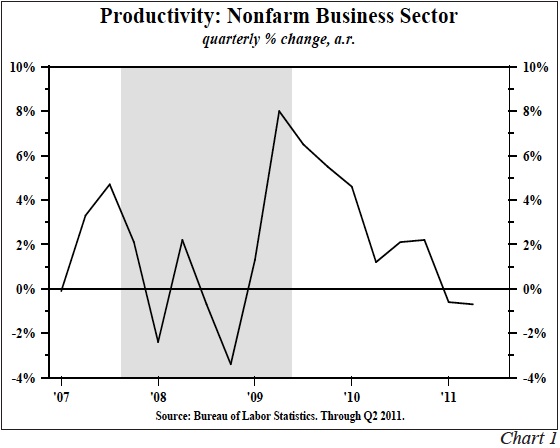
In the last half of 2010, real GDP grew about 2.%. The consensus forecast for 2011 was for growth to accelerate to 3%-4% due to the massive easing of Fed policy (QE2), social security tax cuts, and other fiscal stimuli. Surprisingly, real GDP growth slowed to less than 1% in the first half of this year. When growth slows abruptly and it is markedly at variance to expectation, businesses find they have more employees than desired. Normally, firms are reluctant to resort to layoffs, but a failure to do so means unit labor costs rise swiftly as output per man hour (productivity) falls. This was exactly the experience in the first half of 2011. In the very broad, non-farm business sector, productivity did decrease at a .7% annual rate. Accordingly, unit labor costs surged at a 4.8% rate over the same time period, exceeding the rise in consumer prices.
Historically, a sustained and meaningful drop in productivity and a parallel rise in unit labor costs have been precursors to increased layoffs as businesses struggle to restore margins and profitability. Once these job losses commence, broad negative ramifications are felt throughout the economy (Chart 1).
b) inventory reversal
Inventory investment, the most volatile component of the economy, has contributed substantially to the recovery since 2009. From the second quarter of 2009 to the second quarter of this year, real inventory investment surged by $222 billion, accounting for 35% of the rise in real GDP over that period. Now inventory investment accounts for 1.18% of real GDP, which is .18% above the average since 1990. In July and August, production of consumer goods increased at a 3.2% annual rate versus the second quarter, while real retail sales contracted at a 1.4% rate; therefore, inventory investment moved to an even higher, likely undesired, level. Consequently, as firms move to rebalance inventories, the stage is set for a slowdown in production, requiring a further need to pare staffing levels.
c) real wages
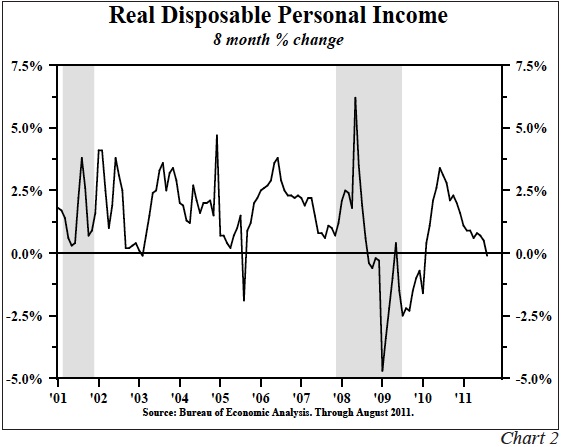
Real average hourly earnings has fallen by 2.2% over the twelve months ending August 2011. Real disposable income (a broader measure of income) was lower in August than last December. Initially, consumers responded to this lack of income growth by cutting their saving rate back to the recession low of 4 .%, but now an evident slowdown in spending has occurred. Real spending expanded by only .7% in the second quarter, and remains sluggish in the third quarter. This lack of real income growth will contribute to the negative changes in GDP in coming quarters (Chart 2).
This reduction in real income can be traced, in part, to the misguided attempts to spur economic growth by the Federal Reserve via quantitative easing (QE2). The QE2 expansion in the Fed's balance sheet backfired as the boost in stock prices (a positive for some consumers) was more than offset by the negative impact of food and fuel inflation on the average family budget. While rising equity values helped a few consumers, inflation in necessities such as food and fuel, decimated real incomes for the average family. Thus, the emergent cyclical weakness that lies ahead can be directly related to the unintended consequences of quantitative easing.
Monetary Policy
Although many measures of economic performance worsened during QE2, the Fed might argue that the recent M2 acceleration may eventually contribute to an improvement in economic growth as deposit growth fuels income expansion. In our opinion, such an optimistic assessment is not warranted.
In the past three months, M2 increased at a rapid annualized pace of more than 20%, and the annual increase in M2 is about 10%, well above the post 1900 average annual increase of 6.6%. This rise in M2, however, appears to reflect a massive balance sheet shift of assets, not a net creation of new assets. Theoretically, if funds are switched from non-M2 assets into M2 assets, M2 velocity would decline and bank loans plus commercial paper would be stable.
This is exactly what has been happening. After peaking at 1.69 in the second quarter of 2010, M2 velocity declined for four consecutive quarters, and we estimate that a major contraction in velocity to 1.59 is likely for the third quarter (Chart 3). Also supporting this idea of asset shifting, bank loans plus commercial paper in September totaled $7.845 trillion, down from $7.906 trillion in June 2010.
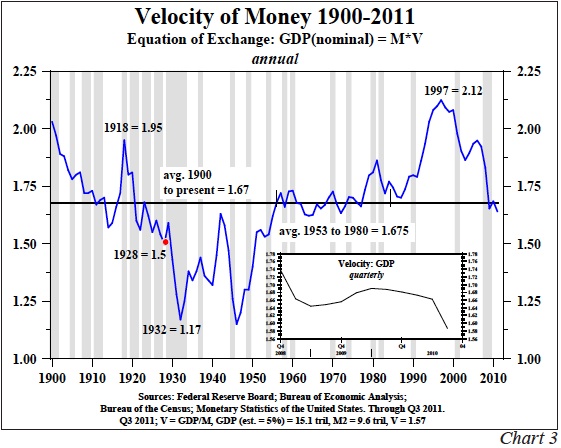
In an environment where short-term interest rates are close to zero, commercial paper has become an increasingly unattractive investment since the low interest rates do not cover the risk premium. As commercial paper has rolled off, issuers have been forced to meet funding requirements from bank loans. However, there are other balance sheet changes taking place along with the shift away from commercial paper. With the credit rating of major European banks sliding, companies operating globally may have moved euro-based deposits into dollar-based ones. Supporting this hypothesis, the dollar strengthened during this surge in M2. Economic stresses and uncertainty are responsible for the increased level of M2, not QE2. The real impact of QE2 was that inflation was boosted and real economic growth stunted.
Maturity Extension Program
The initial market reaction to the announcement of the Fed's latest policy move, known as the Maturity Extension Program (MEP) or Operation Twist, was for commodities and stocks to fall, the dollar to strengthen, and bond yields to decline. Thus, the reaction was to reinforce trends already in place. These market reactions were the exact opposite of what occurred during QE2. Lower commodity prices and the firmer dollar will diminish inflation, thus serving to reverse the drop in real wages that millions of households suffered during QE2. This benefit will not be apparent immediately because the economy has to work through the negative consequences of falling real income and dropping productivity that occurred under QE2. Unfortunately, it is unclear whether Operation Twist will ultimately accrue any benefit to the economy because efforts to achieve very low interest rates could produce counterproductive or unintended consequences.
Banks and other financial intermediaries earn a profit by investing or lending at a rate that exceeds their cost. Due to the low interest rate structure and other considerations, this has become exceedingly difficult, if not impossible. Overnight interest rates are close to zero; thus, to earn a rate above 1% in the treasury market banks must invest at a maturity longer than five years. While this is a positive interest rate spread, all costs may not be covered as banks have to expense payroll, rent, taxes, elevated FDIC fees, and other overhead, and must have a risk or default premium when they lend to a private sector borrower. Therefore, profit erosion of banks and other intermediaries is likely with a lower interest rate structure.
Historical verification of this development is obvious in Japan where more and more of the bank balance sheets have been shifted to government securities rather than to private borrowers. In other words, normal bank lending functions are essentially shut down. This risk now confronts the U.S. with the zero short rate policy and with Operation Twist aimed at lowering yields in the intermediate and long end of the yield curve.
Fiscal Drag
Though budgetary reductions have yet to materialize, fiscal policy via tax increases is also acting as a retardant to growth. The effective tax rate on households can be calculated each month by expressing the sum of federal, state and local taxes as a percent of personal income. From the middle of 2009 to last month, the effective tax rate has risen from 17.5% to 17.9%, a $247 billion tax increase (Chart 4). This rise mainly reflects increased taxation by state and local governments to cover their persistent deficits.

These increases more than offset the first quarter reduction in FICA taxes. Econometric research indicates the U.S. economy will not grow out of the ongoing slump if additional major tax increases are implemented.
In summary, the case for an impending recession rests not only on cyclical precursors evident in productivity, real wages, and inventory investment, but also on the dysfunctionality of monetary and fiscal policy.
Slight Depression
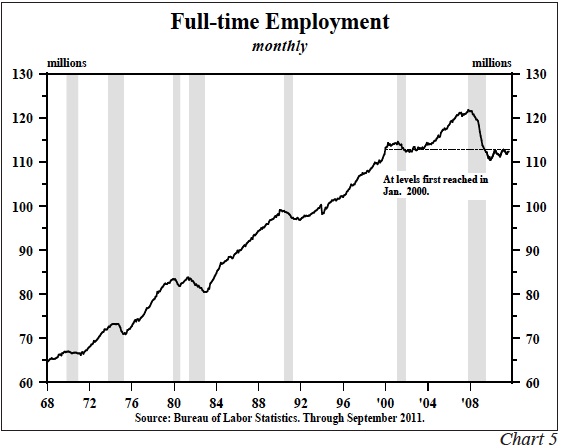
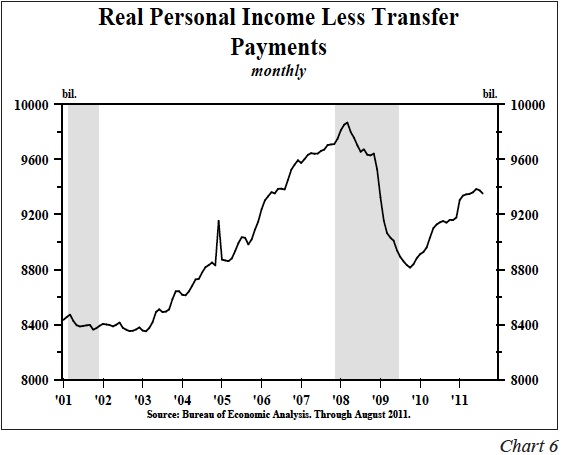
The appearance of a renewed slump only a short twenty-one months after the end of the last recession is highly remarkable. Many statistics support the fact, however, that the U.S. is worse off today than it was prior to the onset of the previous recession. For instance: a) the economy has nearly 9. million fewer fulltime workers employed than at the peak in 2007 (Chart 5); b) real GDP is still below the level reached in Q4, 2007; c) industrial production is 6.7% less than its December 2007 reading; d) real retail sales is $13 billion below its 2007 peak, and e) real personal income (less government transfers) is more than $515 billion below the 2008 peak (Chart 6). The financial markets concur with this "things are worse off" idea. The S&P Index is over 20% lower, and bond yields have dropped more than 40% from their peak levels in 2007. Harvard economic historian Niall Ferguson recently noted that the world is experiencing a "slight depression". This sentiment has also been cogently expressed by Gluskin Sheff's astute economist, David Rosenberg, who notes that, "Depressions are basically long recessions lasting three to seven years." If our analysis of a new contraction in GDP is correct, the U.S. economy should be viewed as operating in the midst of a long-term slump, regardless of terminology.
This economic malaise is a direct result of the accumulation of excessive levels of debt and subsequent reduction in the price level of underlying assets. This is a process that U.S. economist Irving Fisher discussed in his 1933 paper The Debt-Deflation Theory of Great Depressions. According to Fisher and confirmed subsequently by Reinhart and Rogoff and the McKenzie Global Institute, a long period of time is required to unwind previous borrowing excesses. These views were recently econometrically verified in a September 2011 publication by the Bank for International Settlements entitled The Real Effect of Debt. This article, authored by Stephen G. Cecchetti,
M. S. Mohanty and Febrizio Zampolli, stated, "Debt is a two edged sword. Used wisely and in moderation, it clearly improves welfare, but when it is used imprudently and in excess, the result can be disaster. For individual households and firms, over-borrowing leads to bankruptcy and financial ruin. For a country, too much debt impairs the government's ability to deliver essential services to its citizens. High and rising debt is a source of justifiable concern."
Global Debt
We have assembled, with support from Capital Economics in London, foreign debt to GDP ratios that are comparable to the U.S. debt to GDP ratio. The debt figures in these ratios include both private and government debt; thus, they are measures of aggregate indebtedness. These statistics indicate that the euro currency countries as a group, the United Kingdom, Japan and, interestingly Canada, are all more deeply indebted than the United States. This should not give the U.S. solace, nor detract from our severe problems. However, the greater debt in these areas may serve to provide backhanded support for the dollar. More critical is that all major countries are destined to experience slower growth because of excessive indebtedness.
The latest readings indicate that debt to GDP ratios are about: 450% for the Euro zone and the United Kingdom; 470% for Japan, and 410% for Canada. Thus, the Euro Zone, UK, Japan,and Canada ratios are 100%, 100%, 120%, and 60% higher, respectively, than the U.S. debt to GDP ratio of 350%.
We would like to be able to extend this analysis to China because of its rising importance on the global scene. While the Chinese don't provide these statistics, a new book Red Capitalism: The Fragile Financial Foundation of China's Extraordinary Rise by Carl E. Walter and Frasier J.T. Howie (John Wiley, 2011) sheds light on this issue. Carl Walter holds a Stanford Ph.D., is fluent in Mandarin, and resides in Beijing where he has lived for two decades. Walter and Howie acknowledge that China's model has produced super growth, lustrous office towers, massive, grand new airports and other visible signs of wealth and success. Their disquieting theme is that beneath this glamorous veneer the growth model is flawed and fragile. Specifically, they argue that indiscernible, substantial risks are accumulating in the Chinese banking system--in other words, over-indebtedness.
The Bond Market
During the latter part of the 19th and the early 20th centuries the construction of the Trans-Continental railroad created an excessive accumulation of debt. The result was a period of low interest rates when the long treasury yield averaged less than 2.% for more than a decade. In a parallel case, the highly-indebted Japanese economy has seen its thirty year bond yield average about 2% or less since 1998.
In view of the United States extreme over-indebtedness, we believe that 2% is a an attainable level for the long treasury bond yield. In the previous historic cases yields tended to remain close to their record lows for an extended period of time, coinciding with a long period of deleveraging. Presently the U.S. is in its fifth year of deleveraging, and patient investors in the long end of the treasury market have been financially rewarded. We continue to hold long positions in thirty-year treasury debt, but remain increasingly wary of the potential for further adverse meddling by Federal Reserve authorities.
Van R. Hoisington
Lacy H. Hunt, Ph.D
By John F. Mauldin
Outside the Box is a free weekly economic e-letter by best-selling author and renowned financial expert, John Mauldin. You can learn more and get your free subscription by visiting www.JohnMauldin.com.
Please write to johnmauldin@2000wave.com to inform us of any reproductions, including when and where copy will be reproduced. You must keep the letter intact, from introduction to disclaimers. If you would like to quote brief portions only, please reference www.JohnMauldin.com.
John Mauldin, Best-Selling author and recognized financial expert, is also editor of the free Thoughts From the Frontline that goes to over 1 million readers each week. For more information on John or his FREE weekly economic letter go to: http://www.frontlinethoughts.com/
To subscribe to John Mauldin's E-Letter please click here:http://www.frontlinethoughts.com/subscribe.asp
Copyright 2011 John Mauldin. All Rights Reserved
Note: John Mauldin is the President of Millennium Wave Advisors, LLC (MWA), which is an investment advisory firm registered with multiple states. John Mauldin is a registered representative of Millennium Wave Securities, LLC, (MWS), an FINRA registered broker-dealer. MWS is also a Commodity Pool Operator (CPO) and a Commodity Trading Advisor (CTA) registered with the CFTC, as well as an Introducing Broker (IB). Millennium Wave Investments is a dba of MWA LLC and MWS LLC. Millennium Wave Investments cooperates in the consulting on and marketing of private investment offerings with other independent firms such as Altegris Investments; Absolute Return Partners, LLP; Plexus Asset Management; Fynn Capital; and Nicola Wealth Management. Funds recommended by Mauldin may pay a portion of their fees to these independent firms, who will share 1/3 of those fees with MWS and thus with Mauldin. Any views expressed herein are provided for information purposes only and should not be construed in any way as an offer, an endorsement, or inducement to invest with any CTA, fund, or program mentioned here or elsewhere. Before seeking any advisor's services or making an investment in a fund, investors must read and examine thoroughly the respective disclosure document or offering memorandum. Since these firms and Mauldin receive fees from the funds they recommend/market, they only recommend/market products with which they have been able to negotiate fee arrangements.
Opinions expressed in these reports may change without prior notice. John Mauldin and/or the staffs at Millennium Wave Advisors, LLC and InvestorsInsight Publishing, Inc. ("InvestorsInsight") may or may not have investments in any funds cited above.
Disclaimer PAST RESULTS ARE NOT INDICATIVE OF FUTURE RESULTS. THERE IS RISK OF LOSS AS WELL AS THE OPPORTUNITY FOR GAIN WHEN INVESTING IN MANAGED FUNDS. WHEN CONSIDERING ALTERNATIVE INVESTMENTS, INCLUDING HEDGE FUNDS, YOU SHOULD CONSIDER VARIOUS RISKS INCLUDING THE FACT THAT SOME PRODUCTS: OFTEN ENGAGE IN LEVERAGING AND OTHER SPECULATIVE INVESTMENT PRACTICES THAT MAY INCREASE THE RISK OF INVESTMENT LOSS, CAN BE ILLIQUID, ARE NOT REQUIRED TO PROVIDE PERIODIC PRICING OR VALUATION INFORMATION TO INVESTORS, MAY INVOLVE COMPLEX TAX STRUCTURES AND DELAYS IN DISTRIBUTING IMPORTANT TAX INFORMATION, ARE NOT SUBJECT TO THE SAME REGULATORY REQUIREMENTS AS MUTUAL FUNDS, OFTEN CHARGE HIGH FEES, AND IN MANY CASES THE UNDERLYING INVESTMENTS ARE NOT TRANSPARENT AND ARE KNOWN ONLY TO THE INVESTMENT MANAGER.
John Mauldin Archive |
© 2005-2022 http://www.MarketOracle.co.uk - The Market Oracle is a FREE Daily Financial Markets Analysis & Forecasting online publication.