


Gold Not Going Anywhere, Could Stumble Again
Commodities / Gold and Silver 2011 Oct 16, 2011 - 12:56 PM GMTBy: Merv_Burak

 In the “good old days” gold would move $10 and that was something, now it moves $50 and it’s ho-hum. Although moving higher slowly it really is not going anywhere and unfortunately looks like it just might stumble.
GOLD : LONG TERM
Gold continues to hold on to its bullish long term rating but only just so. The next stumble in the price just might take gold into the bearish camp but that’s for tomorrow, let’s look at today.
Trend: The recent gold action remains just above its positive sloping long term moving average and above the first FAN trend line. As it now looks, a close at or below the $1580 level just might turn everything to the negative.
Strength: The action over the past couple of weeks has not been all that strong. The long term momentum indicator has been tracking an almost horizontal path although still in its positive zone.
Volume: Although the price has been moving very slowly in an upward direction the volume indicator has been stalemated and is moving in a horizontal path. It is below its trigger line and the trigger has turned to the down side.
As of the Friday close the long term rating remains BULLISH.
INTERMEDIATE TERM
Trend: The recent price action remains below its negative sloping intermediate term moving average line.
Strength: The intermediate term momentum indicator has been hugging its neutral line for the past couple of weeks. The Friday close has seen the indicator slightly above the neutral line in the positive zone and slightly above a positive trigger line.
Volume: As with the long term volume indicator what we have here is a stalemated indicator tracking below its negative sloping trigger line.
At the Friday close the intermediate term rating can be classified as a – NEUTRAL rating due to the barely positive momentum. The short term moving average line remains below the intermediate term line confirming that a reversal to the bull has not yet occurred.
SHORT TERM
The short term is the real interesting time period to watch. Some interesting stuff here.
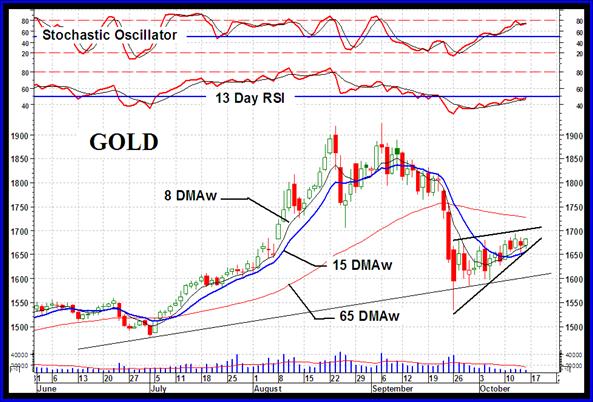
Trend: First the obvious. The price has been above its short term moving average line all week and the line has turned upward. As the chart shows, the move during the week has not been that aggressive. What we ended up with is a pattern that suggests another move ahead, to the down side. These upward sloping wedge patterns, after a price decline, are just a rest period for the price before it continues on its previous path. That would be to the down side. Now, some texts suggest that we often get these continuation patterns in a mid-way of a trend. This would suggest a move to somewhere about the $1200 level depending upon where you start the move from. I have been suggesting for some weeks now that I see the price breaking through that long term FAN trend line (shown) and now we have a second pattern that suggests the same.
Strength: The short term momentum indicator has been rising steadily over the past few weeks and remains above its positive sloping trigger line but still slightly inside its negative zone. Although trending positively it is not showing much strength behind the price move.
Volume: As one can see from the chart the daily volume activity remains very low and continues to be below its 15 day average volume. This is not encouraging during an upward trending price action.
At the Friday close although the momentum indicator is still very slightly in its negative zone the overall short term rating is BULLISH. The very short term moving average line is above the short term line confirming this bull.
As for the immediate direction of least resistance, although the price is trending higher, above the very short term moving average line and the Stochastic Oscillator is also trending upwards in its positive zone I will go with the down side over the next day or two. This is primarily due to that upward sloping wedge. The break below the wedge pattern very often occurs at its two thirds point along the wedge, where it is right now so it has to break on the down side or the message of the wedge pattern would be nullified.
SILVER
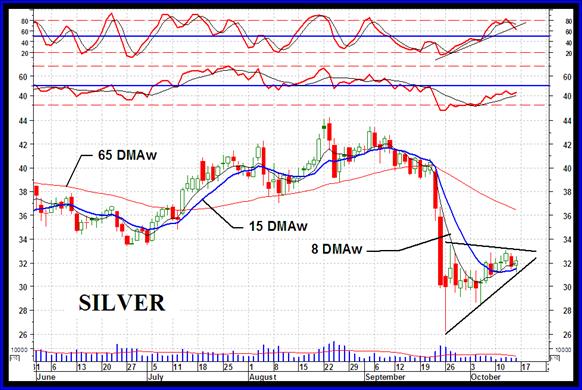
Although the “box” pattern that we I had shown last week is still there (for gold also) by the end of this past week we have another pattern showing up. Similar to the gold wedge, we have here more of a triangular pattern but the prognosis is the same. This is considered a continuation pattern with the break expected to be to the down side. The price is just about past the point when a break is expected so it should come on Monday or the latest, Tuesday or else it just may not come. A general thinking is that the break should come at the two thirds point from the start of the pattern to the apex. The closer the break gets to the apex after that the weaker the break is expected to be. Just some thoughts.
LONG TERM: Nothing has changed from last week. Everything is still negative and the rating, at the Friday close, is still BEARISH.
INTERMEDIATE TERM: Nothing in the chart or indicators has changed from last week and the rating, on the Friday close, still remains BEARISH.
SHORT TERM
Trend: Silver crossed above its short term moving average on Monday and had stayed above all week. The moving average itself has now turned to the up side.
Strength: The short term momentum indicator continues to move higher above its positive sloping trigger line but is still in its negative zone.
Volume: The daily volume action remains low, too low to give us any confidence that the positive move will last any length of time.
At the Friday close the short term rating is BULLISH. This is further confirmed by the very short term moving average line having moved above the short term line.
As for the immediate direction of least resistance, for the same reasons mentioned in the gold section I am going with the down side for the next day or two.
Merv’s Non-Edibles Futures Indices Table
Well, that’s it for this week. Comments are always welcome and should be addressed to mervburak@gmail.com.
By Merv Burak, CMT
Hudson Aero/Systems Inc.
Technical Information Group
for Merv's Precious Metals Central
For DAILY Uranium stock commentary and WEEKLY Uranium market update check out my new Technically Uranium with Merv blog at http://techuranium.blogspot.com .
During the day Merv practices his engineering profession as a Consulting Aerospace Engineer. Once the sun goes down and night descends upon the earth Merv dons his other hat as a Chartered Market Technician ( CMT ) and tries to decipher what's going on in the securities markets. As an underground surveyor in the gold mines of Canada 's Northwest Territories in his youth, Merv has a soft spot for the gold industry and has developed several Gold Indices reflecting different aspects of the industry. As a basically lazy individual Merv's driving focus is to KEEP IT SIMPLE .
To find out more about Merv's various Gold Indices and component stocks, please visit http://preciousmetalscentral.com . There you will find samples of the Indices and their component stocks plus other publications of interest to gold investors.
Before you invest, Always check your market timing with a Qualified Professional Market Technician
Merv Burak Archive |
© 2005-2022 http://www.MarketOracle.co.uk - The Market Oracle is a FREE Daily Financial Markets Analysis & Forecasting online publication.