


Stock Market S&P 500 Index Getting Close to a Top
Stock-Markets / Stock Markets 2011 Oct 16, 2011 - 12:15 PM GMTBy: J_W_Jones

 The past few months have been very difficult to navigate for retail investors and institutional money managers. The huge week to week price swings and increased volatility have made the current market conditions exceptionally difficult to maneuver. Day traders are about the only group of market participants that outperform during periods such as we have seen since the beginning of August.
Before I jump into the analysis, I would like to point out to readers that the S&P 500 Index (SPX) has rallied from 1,075 on October 4th to 1224.50 on October 14th. The S&P 500 has rallied almost 150 handles or 14% from the lows to Friday’s close in 10 calendar days. As an options trader and a market participant, I trade the market that I see, not the market that I want. With that said, ask yourself this question: Does a healthy financial construct rally 14% in 10 calendar days?
To put the recent price action into perspective, since the beginning of the year 2000 the S&P 500 would have had a poor track record on an annualized basis when compared to the past 10 calendar days’ trough to peak performance. Only in the years 2003, 2006, 2009, & 2010 would an investor have been able to best the previous 10 calendar days’ performance (Performance data courtesy of Wikipedia). The most amazing thing about the recent price action is that the S&P 500 Index is still underwater for the year even after rallying roughly 14%.
At this point two scenarios are likely to play out. One scenario involves a rally on the S&P 500 towards the key 1,250 – 1,270 resistance zone which is outlined on the chart below. The recent price action in the S&P 500 has been volatile and at this point it has gone nearly parabolic. The daily chart of the S&P 500 Index is shown below:
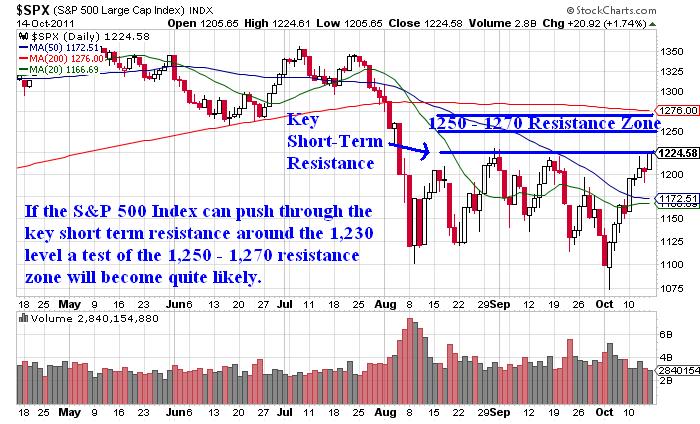
The resistance level shown in the chart above outlines the key 1,250 – 1,270 resistance zone that will be tested if the S&P 500 can breakout above the 1,230 resistance level. However, it is critical for traders to recognize that probabilities are starting to favor the short side. Let me explain.
If the S&P 500 is able to rally into the 1,250 - 1,270 level it would represent a gain of less than 4%. The bears will vigorously defend the S&P 1,250 – 1,270 resistance zone and it is unlikely that price action will be able to take out that resistance zone on the first breakout attempt.
With only 4% upside, the odds of some sort of correction are favorable at this point in time. Whether the correction begins early next week or whether we have to wait until the key resistance zone is tested, sellers will step back into the driver’s seat in the not-so-distant future.
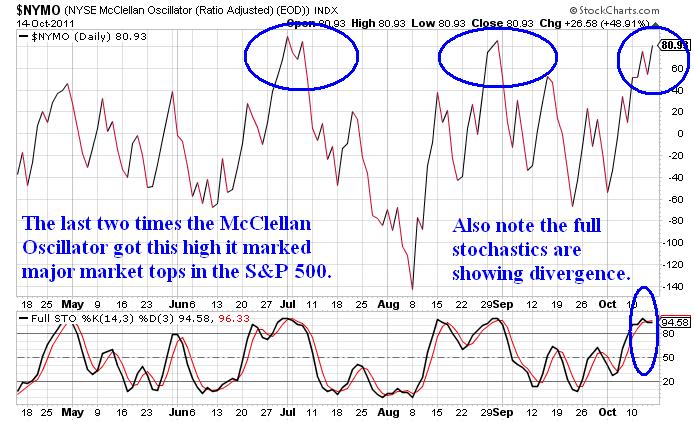
McClellan Oscillator
A few data points that exemplify the overbought status of the S&P 500 are shown below. The first indicator is the McClellan Oscillator that my trading buddy Chris Vermeulen pointed out to me.
50 Period Moving Average Momentum Chart
The momentum chart shown below courtesy of www.barchart.com illustrates the number of domestic equities trading above their key 50 period moving averages:
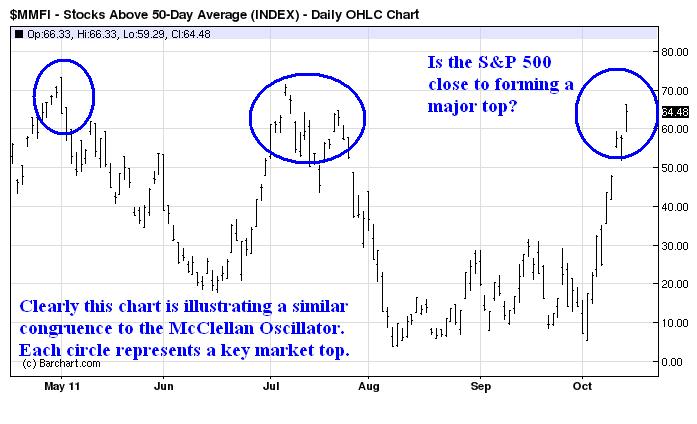
Both charts above are warning signs that this rally is starting to get a bit overheated. I would point out that the past two times the McClellan Oscillator and the momentum chart peaked a nasty selloff occurred shortly thereafter. The one point that I would like to make clear to readers is that each time both indicators peaked prices eventually went much lower.
The evidence would lead astute traders to believe a top was near. The more arduous details about the future of the S&P 500’s price action revolve around where the topping formation will be. Will the S&P 500 find resistance on a second test of the key 1,230 resistance level?
The other scenario would involve higher prices next week that eventually reach the key 1,260 – 1,270 area on the S&P 500. Will price work roughly 4% higher before confirming a top at the key breakdown level that initiated the selloff back in August?
Conclusion
I am of the opinion that a topping formation or pattern is likely near, but the location of the top is unknown to me presently. More importantly the forthcoming selloff resolution will be very telling about the current trend of the marketplace.
The most constructive price action that we could see would be a selloff that results in a higher low on the daily chart. If that type of price action plays out a new bullish run could begin. However, if we form a top and price action breaks down below recent lows it would not be surprising to see another lower low form which would put the trend squarely in favor of the bears.
The most important aspect of coming weeks will not necessarily be where a top forms, but if and when a selloff begins. Ultimately the depth, momentum, and ferocity of the selloff are more important than where the topping pattern begins.
At this point I have no purely directional trades on the books, but I am developing a laundry list of shorts that make sense. After all, volatility has declined quite a bit and puts are starting to get a whole lot cheaper!
In closing, a top is likely in the cards in the near future. However, the strength and momentum of the forthcoming selloff will tell the real story about the future direction of stock prices. The next few weeks should be quite interesting!!
Review my track record and join now at http://www.optionstradingsignals.com/specials/index.php and receive a 66% off coupon which expires tomorrow.
J.W. Jones is an independent options trader using multiple forms of analysis to guide his option trading strategies. Jones has an extensive background in portfolio analysis and analytics as well as risk analysis. J.W. strives to reach traders that are missing opportunities trading options and commits to writing content which is not only educational, but entertaining as well. Regular readers will develop the knowledge and skills to trade options competently over time. Jones focuses on writing spreads in situations where risk is clearly defined and high potential returns can be realized.
This article is intended solely for information purposes. The opinions are those of the author only. Please conduct further research and consult your financial advisor before making any investment/trading decision. No responsibility can be accepted for losses that may result as a consequence of trading on the basis of this analysis.
© 2005-2022 http://www.MarketOracle.co.uk - The Market Oracle is a FREE Daily Financial Markets Analysis & Forecasting online publication.