


Another Similar Stock Market 2008 Crash Chart Pattern
Stock-Markets / Financial Crash Oct 13, 2011 - 03:01 AM GMTBy: Tony_Pallotta

 "He observed that human emotions collectively had major impacts on the movement of stock prices and markets in general, ultimately creating patterns that kept repeating." - From a book on Jesse Livermore's trading style
Without a doubt one common similarity between the current market and the fall of 2008 is heightened investor emotions. There are plenty of other similarities from bank nationalizations, a deteriorating global economy and government intervention.
There were wild swings and volatility that whipsawed traders out of positions and saw paper profits appear and disappear in very short order. Traders then as they are today were simply exhausted and decisions were more influenced by emotions than macro data, technical analysis or convictions.
I strongly believe in Jesse Livermore's theory about human emotion forming patterns and since humans never change patterns will often repeat. I've been trying to find a pattern that compares to the current market. A roadmap if you will of how this emotional roller coaster finally plays out.
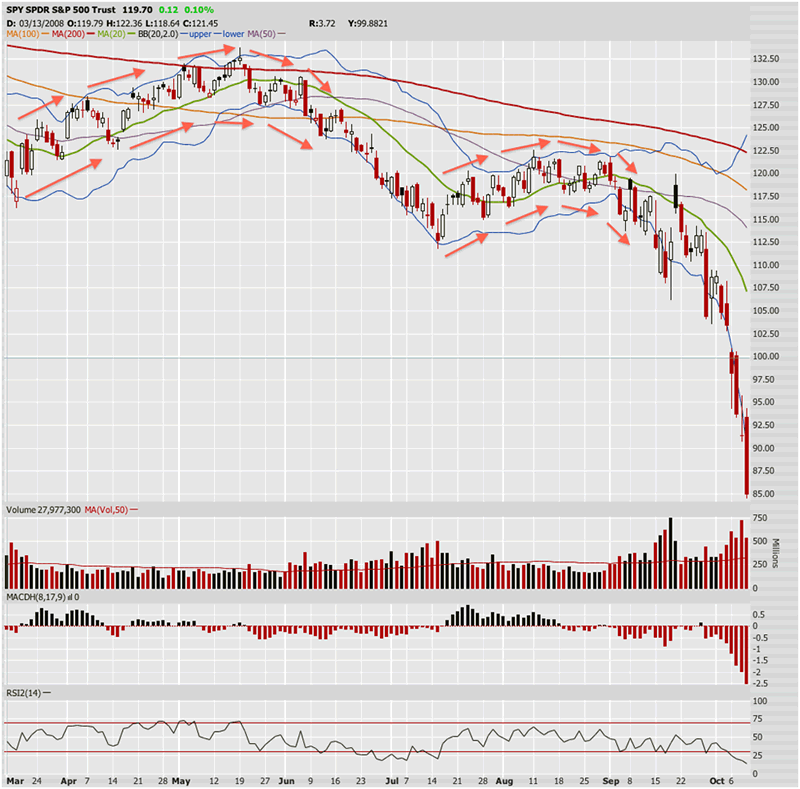
I think I may have found it. Below are two charts. The first shows a rounded top pattern that appeared twice in the fall of 2008.
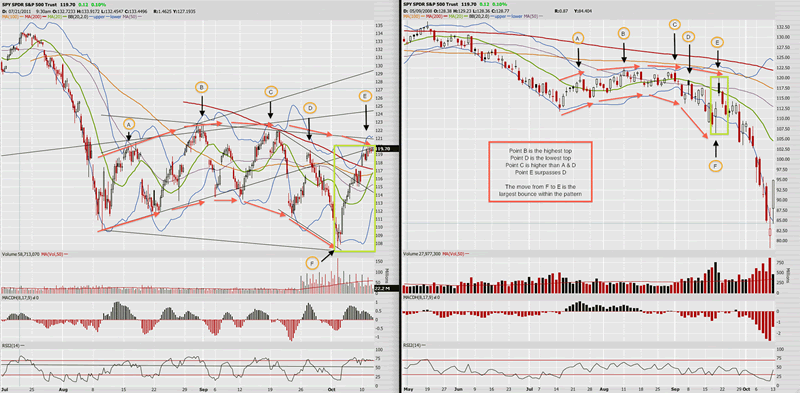
The next chart shows the current markets (SPY 60 day 4 hour chart) versus the fall 2008 (SPY daily chart). There are six points of reference, five are tops Point A, B, C, D and E and one bottom Point F. In both cases the behavior of all six points are identical.
What I found most intriguing was how Point F saw the biggest rally into Point E of the entire pattern. If you look at the pattern notice how the top remains symmetrical while the bottom loses its symmetry beyond the half way point and begins turning lower.
My reason for finding such interest in this comparison is as Jesse Livermore said human emotions never change and they are repeated in patterns. The emotions facing traders now are the same as in the Fall of 2008. Those emotions are reflected in price fluctuations. They lead to violent swings. They lead to whipsaw action as decisions are made in haste, under duress.
There is no guarantee how the 2011 roadmap will play out but I find the 2008 similarities very intriguing. There is no reason to believe investor psychology is any different today than it was just three years prior.
Extra credit for those still reading. Here are a few other eerily similar comparisons.
In 2008 Point E was 106.25 versus 107.43 in 2011.
In 2008 Point F was 119.95 versus 120.04 (so far) in 2011.
May 19, 2008 the market topped at 133.78 versus 135.80 on May 2, 2011
By Tony Pallotta
Bio: A Boston native, I now live in Denver, Colorado with my wife and two little girls. I trade for a living and primarily focus on options. I love selling theta and vega and taking the other side of a trade. I have a solid technical analysis background but much prefer the macro trade. Being able to combine both skills and an understanding of my "emotional capital" has helped me in my career.
© 2011 Copyright Tony Pallotta - Disclaimer: The above is a matter of opinion provided for general information purposes only and is not intended as investment advice. Information and analysis above are derived from sources and utilising methods believed to be reliable, but we cannot accept responsibility for any losses you may incur as a result of this analysis. Individuals should consult with their personal financial advisors.
© 2005-2022 http://www.MarketOracle.co.uk - The Market Oracle is a FREE Daily Financial Markets Analysis & Forecasting online publication.