How Long Will This Economic Depression Last? Five Key Data Points That Can’t Be Ignored
Economics / Great Depression II Oct 11, 2011 - 01:09 PM GMTBy: Mac_Slavo
 Living within the realm of a 24 hour news cycle can often make it seem like things really are getting better. On any given day a particular company may report better than expected earnings, the Dow Jones may rise 250 points, and a few thousands more workers than expected were hired into private sector jobs. As a result, we receive a string of positive assessments on the economy, despite the fact that just one day prior we may have had central bankers and IMF advisors suggesting a depressionary collapse was all but inevitable.
To keep things in perspective we present several data points which we consider to be quite important to the overall health of the economy. Data and statistics that provide a longer-term view, as opposed to a daily or weekly micro snapshot, and let you decide how well the economy is doing and whether we “dodged a recession,” as one economist recently suggested.
1. ECONOMIC GROWTH (GDP)
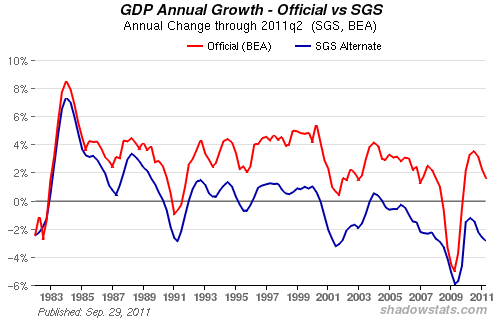
While mainstream economic consensus indicates the economy is growing at a sluggish pace of anywhere from 1% to 2.5%, the real data suggests otherwise. When we look at the data and consider all of the factors involved, we end up with the real Gross Domestic Product as defined and calculated by John Williams of Shadowstats.com, which indicates a NEGATIVE growth rate for the economy at nearly -3%.
“The SGS-Alternate GDP reflects the inflation-adjusted, or real, year-to-year GDP change, adjusted for distortions in government inflation usage and methodological changes that have resulted in a built-in upside bias to official reporting.“
2. FORECLOSURE FILINGS
A recent report from RealtyTrac says that foreclosure filings in the month of August rose 33% – the largest increase in nine months. According to the following report from NBC, one in eighty homes in the United States are in some stage of foreclosure:
3. FOOD STAMP PARTICIPATION
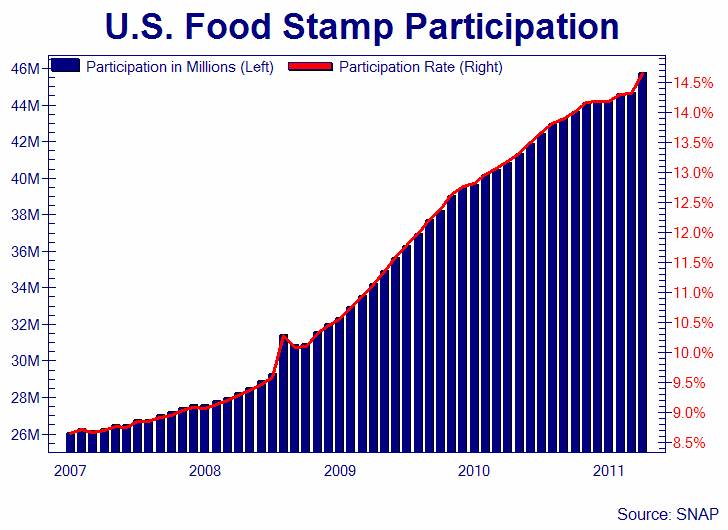
If there’s one record that has been broken month after month almost every single month for the last four years, it’s the Supplemental Nutritional Assistance Program, or SNAP, participation rate. In January of 2011, with about 43 million people receiving assistance nationwide, we wrote Broke and Hungry, where we suggested that participation in the program would not decline, and that we would see at least 50 million Americans in the program within 18 months. We’re well on our way. As of this writing, 45.8 million Americans are dependent on government assistance just to put food on the table – and the trend shows no signs of abating.
Over 15% of our countrymen, roughly one in six, are now registered with the SNAP program. Think about that for a minute. ONE IN SIX people in the United States of America – purportedly the richest country in the world – can’t buy their own food.

4. WAGES
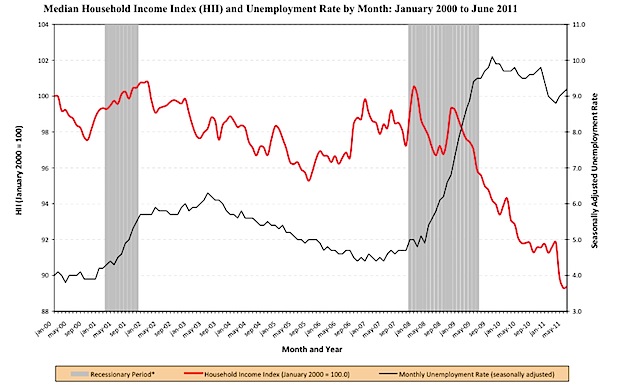
According to Sentierr Research, we’ve seen a decline in real median household income of over 10% from December of 2007 through June of 2011. Curiously, 6.7% of that decline came during the “recovery” period following the official recession!
The following chart from Reuters provides a visual of the collapse in wages, which in reality is a collapse in the purchasing power of our dollars.
In dollar terms, median household income is now $49,909, down $3,609 — or 6.7% — in the two years since the recession ended. It was as high as $55,309 in December 2007, when the recession began.

5. UNEMPLOYMENT
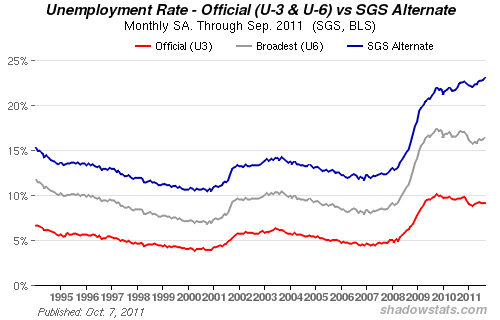
When talking about ecomonic recovery, there’s one statistic that simply can’t be ignored: the unemployment rate. Despite what Vice President Joe Biden may think, you can’t have economic growth dependent on consumption if you don’t have consumers. Officially, we’re told that the unemployment rate is a recovery healthy 9.1%. In reality however, it’s more than double that, as evidenced, once again, by John Williams of Shadow Stats:
The seasonally-adjusted SGS Alternate Unemployment Rate reflects current unemployment reporting methodology adjusted for SGS-estimated long-term discouraged workers, who were defined out of official existence in 1994. That estimate is added to the BLS estimate of U-6 unemployment, which includes short-term discouraged workers.
The U-3 unemployment rate is the monthly headline number. The U-6 unemployment rate is the Bureau of Labor Statistics’ (BLS) broadest unemployment measure, including short-term discouraged and other marginally-attached workers as well as those forced to work part-time because they cannot find full-time employment.

The question on the minds of most Americans is: Are we going to avoid another recession?
The more appropriate question to ask, in our view, is how long will this economic depression last, and how much worse is it going to get?
By Mac Slavo
http://www.shtfplan.com/
Mac Slavo is a small business owner and independent investor focusing on global strategies to protect, preserve and increase wealth during times of economic distress and uncertainty. To read our commentary, news reports and strategies, please visit www.SHTFplan.com
© 2011 Copyright Mac Slavo - All Rights Reserved
Disclaimer: The above is a matter of opinion provided for general information purposes only and is not intended as investment advice. Information and analysis above are derived from sources and utilising methods believed to be reliable, but we cannot accept responsibility for any losses you may incur as a result of this analysis. Individuals should consult with their personal financial advisors.
© 2005-2022 http://www.MarketOracle.co.uk - The Market Oracle is a FREE Daily Financial Markets Analysis & Forecasting online publication.
Comments
|
Parth V
11 Oct 11, 16:53 |
Depression ends when housing recovers
Its really that simple, 2016 at the earliest. Unless we are in WW3. |


