


Hypothetical U.S. Employment and Unemployment Charts from the Atlanta Fed
Economics / Unemployment Oct 10, 2011 - 05:58 AM GMTBy: Mike_Shedlock

 Inquiring minds are checking out an interesting "what if" post by Dave Altig, senior vice president and research director at the Atlanta Fed. Please consider Two more job market charts
Payroll employment growth has averaged about 110,000 jobs a month since February 2010, the jobs low point associated with the crisis and recession. This growth level compares, unfavorably, with the 158,000 jobs added per month during the last jobs recovery period from August 2003 (the low point following the 2001 recession) through November 2007 (the month before the recent recession began). One hundred and ten thousand jobs a month compares favorably, however, to the 96,000 job creation pace so far this year.
Are these sorts of differences material? If the economy can find its way to creating jobs at the same rate as the last recovery—which nobody remembers as particularly off-the-chart spectacular—we would be back to the prerecession level of overall employment by spring 2015. If, on the other hand, we can only eke out the sub-100k pace we've seen this year, that date moves out to 2017:
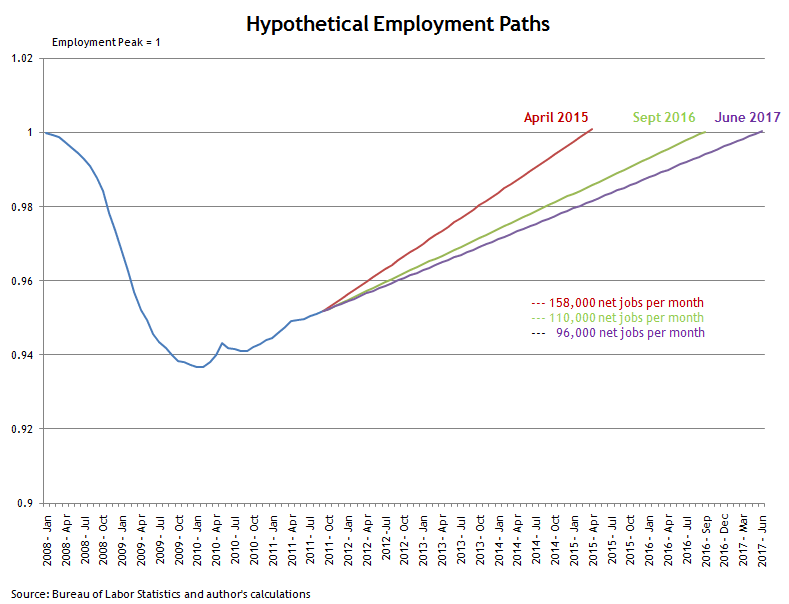
With a few assumptions, such as the presumptions that the labor force will grow at the same rate as census population projections (for the aficionados, my calculations also assume that the ratio of household employment to establishment employment is equal to its average value since January of this year), the unemployment rates associated with job growth of 158,000, 110,000, and 96,000 per month would look something like this:
These paths are just suggestive, of course, but I think they tell the story. The same jobs recovery rate of the prerecession period would get the unemployment rate down below 7 percent in four years or so. But at the pace we have been going this year, things get worse, not better.
Good Starting Point for Discussion
I think those charts are an good starting point for discussion, but there are many other factors to consider.
Right now it takes about 125,000 jobs a month to keep up with demographics (birthrate, retirement, and immigration). 125,000 is Bernanke's estimate and I accept it as reasonable.
Because of boomer demographics, by 2016 or so it may take far less than that (perhaps 90,000 jobs a month or so) to keep up with demographics. Then if the demographic trends hold, the number may rise through 2020.
Unfortunately, it is not as simple as that. One must also factor in the ability of workers to retire when they had planned. Many boomers are very underfunded and thus unable to retire when they thought.
Also consider involuntary retirement. Many of those who exhausted all of their unemployment benefits and are approaching retirement age, so desperately need money that they may retire, just to get something from social security. They did not want to retire, but did so out of necessity.
Such factors are a significant reason for the plunge in the participation rate.
Participation Rate
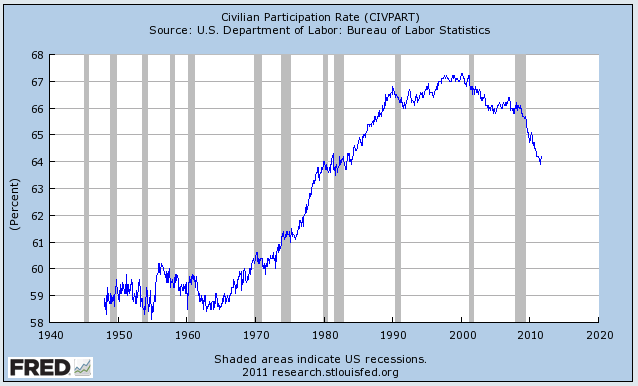
The falling participation rate is the primary reason the unemployment rate is 9.1% instead of 11% right now.
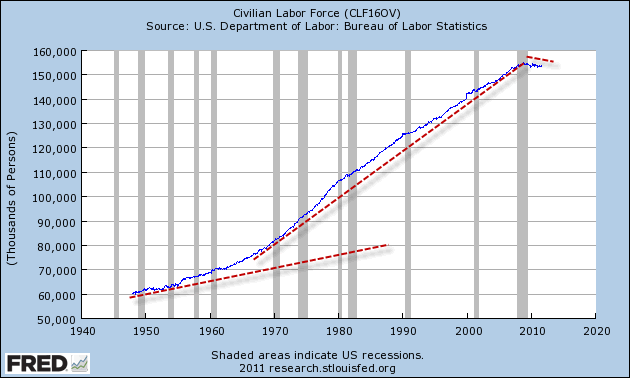
The civilian labor force offers another look at the current sorry state of affairs.
Civilian Labor Force
Civilian Labor Force Detail Since 1990
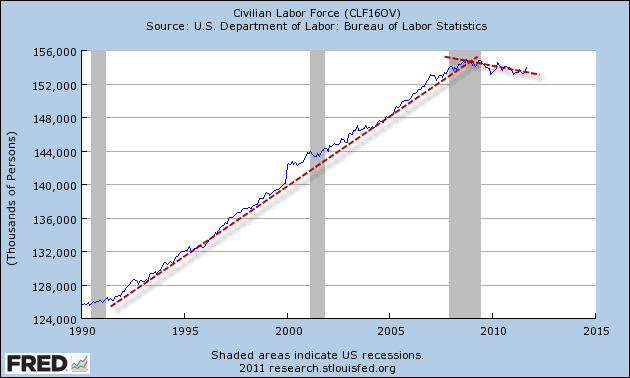
Here is one of the assumptions made by Dave Altig "With a few assumptions, such as the presumptions that the labor force will grow at the same rate as census population projections the unemployment rates associated with job growth of 158,000, 110,000, and 96,000 per month would look something like ..."
Had Altig made those same assumptions two years ago, the projected unemployment rate for today would not be 9.1% but rather something much higher.
Pent-Up Demand for Jobs
As of September 2011, the civilian labor force was 154.017 million. In September of 2008 it was 154.613 million.
In three years, the labor force fell by 596,000 workers when the expectation would have been 125,000 a month or an increase of 4.5 million workers.
Demographics accounts for some of that drop (to the extent there was voluntary retirement). However, most of that, in my opinion is people dropping out of the labor force unwillingly.
Let's do the math based on projected labor force and current employment of 140.025 million.
Labor Force at Hypothetical Growth Rates Since September 2008
At 125,000 persons per month the labor force would now be 159.113
At 100,000 persons per month the labor force would now be 158.213
At 075,000 persons per month the labor force would now be 157.313
At 050,000 persons per month the labor force would now be 156.413
Unemployment Rate at Hypothetical Growth Rates Since September 2008
At 125,000 persons per month the unemployment rate would now be 12.0%
At 100,000 persons per month the unemployment rate would now be 11.5%
At 075,000 persons per month the unemployment rate would now be 11.0%
At 050,000 persons per month the unemployment rate would now be 10.5%
Had the labor force grown by a mere 75,000 per month vs. expected 125,000 per month, the current unemployment rate would be 11%.
If jobs become available, what subset of the 4.5 million workers who would have expected to be in the labor force (but vanished) start looking for jobs? Assume 33%. That is 1.5 million jobs or 62,500 jobs per month over two years, or 50,000 jobs a month over three years.
If so, even if the economy adds 158,000 jobs per month and only 100,000 of them are needed to keep up with demographics, the unemployment rate will essentially be flat if as few as 33% of those who dropped out of the labor force over the past three years start looking.
The irony is that the better the economy the more people will be tempted to come back into the labor force and the more upward pressure on the participation rate and unemployment rate as well.
Thus, we cannot assume that 158,000 jobs per month will necessarily take the unemployment rate to 7% by 2017. Moreover, I highly doubt the economy averages 158,000 jobs a month in the first place.
Monthly Job Growth 1999-2009
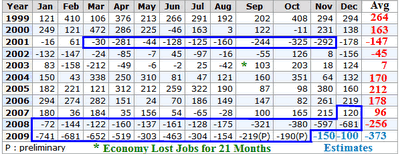
I posted the above table in November of 2009. The key years are 1999, 2005, and 2006.
Chart courtesy of BLS. Annotations by me, numbers are in thousands.
The areas in deep blue mark recessions.
- At the height of the internet bubble with a nonsensical Y2K scare on top of that, the economy managed to gain 264,000 jobs a month.
- At the height of the housing bubble in 2005, the economy added 212,000 jobs a month.
- At the height of the commercial real estate bubble with massive store expansion, the economy added somewhere between 96,000 and 178,000 jobs per month depending on where you mark the peak.
Therefore, I suggest 158,000 jobs a month is highly unlikely on a sustained basis.
September 2011 Data
In September, the number of employed rose by a whopping 398,000! The only reason the unemployment rate did not collapse is the labor force rose by an even larger 423,000 workers.
I am not sure what to make of those numbers but if the labor force continues to jump, and employment does not, the unemployment rate will soar. Likewise, if the number of jobs jump and the labor force does not, the unemployment rate will plunge.
Here are the numbers.
Household Data
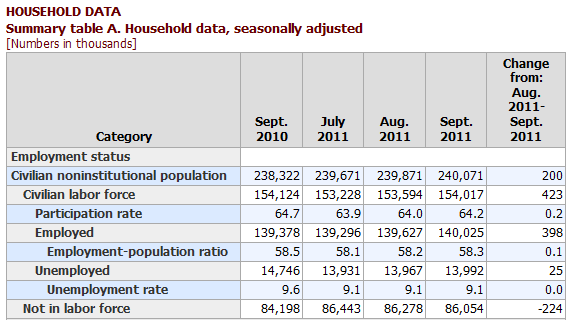
Table A-8 Part Time Status
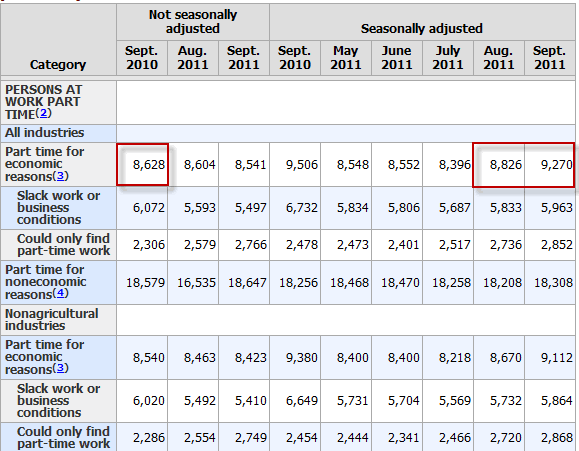
In the last month, the number of people working part-time for economic reasons jumped by 444,000.
Since there was an increase in 398,000 but also an increase in 444,000 were part-time 46,000 full-time jobs were lost last month.
Extrapolation Highly Error-Prone
Even if the economy miraculously produces 158,000 jobs a month I suggest pent-up demand for jobs will prevent the unemployment rate from dropping as fast as the chart by Altig suggests. The point is moot because that number of jobs is highly unlikely in the first place.
Should Congress do something really stupid, like pass protectionist legislation that the president signs, I expect it will cost 2 million jobs. Please see Ben Bernanke Fans Fires of Protectionist Legislation to Senate Joint Economic Committee; Expect Global Depression if Obama Signs On for my reasoning.
Factors
- Number of jobs to keep unemployment rate flat (all other things being equal) should decline to 90,000 or so by 2015 or 2016 then start rising.
- Boomers eligible to retire many not want to because of insufficient funds
- Boomers may retire involuntarily to collect social security after unemployment benefits expire
- There is a pent-up demand for somewhere between 1 million and 4.5 million jobs. That number will act as a huge force preventing a rapid decline in the unemployment rate should the economy improve
- Protectionist legislation
- Potential jobs bills unlikely until after the next election
All things considered, I see no reason to change a forecast I made just over two years ago: Expect Structurally High Unemployment for a Decade.
Harsh Reality From BernankeIn contrast, here is the Obama estimate.
In the Incredible Shrinking Boomer Economy I noted a harsh reality quote of Bernanke:
"It takes GDP growth of about 2.5 percent to keep the jobless rate constant. But the Fed expects growth of only about 1 percent in the last six months of the year. So that's not enough to bring down the unemployment rate."
Pray tell what happens if GDP can't exceed 2.5% for a couple of years? What about a decade (or on and off for a decade)?
If you have come to the conclusion that we are going to have structurally high unemployment for a decade, you have come to the right conclusion.
Note that Obama projected the unemployment rate to be under 6% now according to projections of the the American Recovery and Reinvestment Act of 2009.
The only reason the unemployment rate is not 11% (or higher) is because 4.5 million people dropped out of the labor force vs. expected demographic gains.
By Mike "Mish" Shedlock
http://globaleconomicanalysis.blogspot.com Click Here To Scroll Thru My Recent Post List
Mike Shedlock / Mish is a registered investment advisor representative for SitkaPacific Capital Management . Sitka Pacific is an asset management firm whose goal is strong performance and low volatility, regardless of market direction.
Visit Sitka Pacific's Account Management Page to learn more about wealth management and capital preservation strategies of Sitka Pacific.
I do weekly podcasts every Thursday on HoweStreet and a brief 7 minute segment on Saturday on CKNW AM 980 in Vancouver.
When not writing about stocks or the economy I spends a great deal of time on photography and in the garden. I have over 80 magazine and book cover credits. Some of my Wisconsin and gardening images can be seen at MichaelShedlock.com .
© 2011 Mike Shedlock, All Rights Reserved.
© 2005-2022 http://www.MarketOracle.co.uk - The Market Oracle is a FREE Daily Financial Markets Analysis & Forecasting online publication.