


Gold Intermarket Insights
Commodities / Gold and Silver 2011 Oct 09, 2011 - 06:13 PM GMTBy: Capital3X

 We analyze Gold charts by looking at Inter-market analysis for the month of October. This is an update from our August Gold analysis and September Gold analysis all of which had noticed the stalling Gold at 1888 before we issued our shorts to catch the trend move to 1603.
We have kept our commentary to as little as possible as the charts are self explanatory.
Gold DAILY Charts
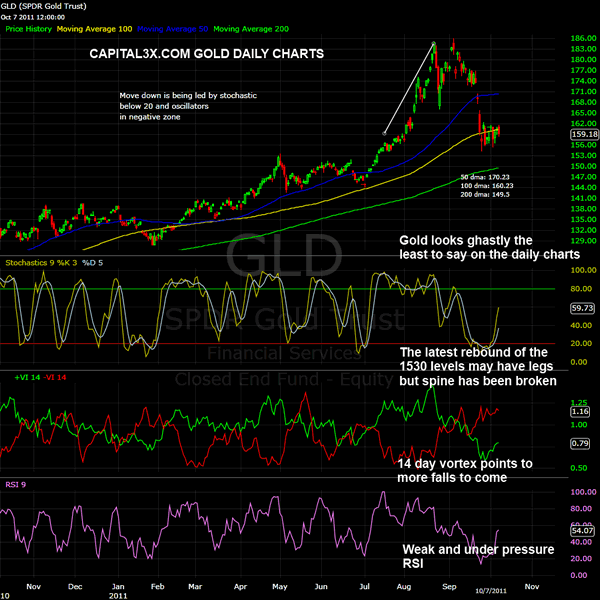
The double top on GLD charts is evident and such patterns can immediately lead to falls of more than 20% if not more. In case of Gold it corrected from 1913 to 1528 all in the space of one month obviously led by forced liquidation of EU banks which were forced to raise cash levels in Sept. CME too played it part by raising Gold margins by over 20%
On the daily charts Gold rests on its 100 dma at 159.18 while the 100 DMA stands at 160.3. To note the importance, Gold has never challenged the 100 dma in the last 8 months.
On the daily charts, there is scope for further rise but we will need to look at other intermarket analysis to understand Gold price action
Gold WEEKLY Charts
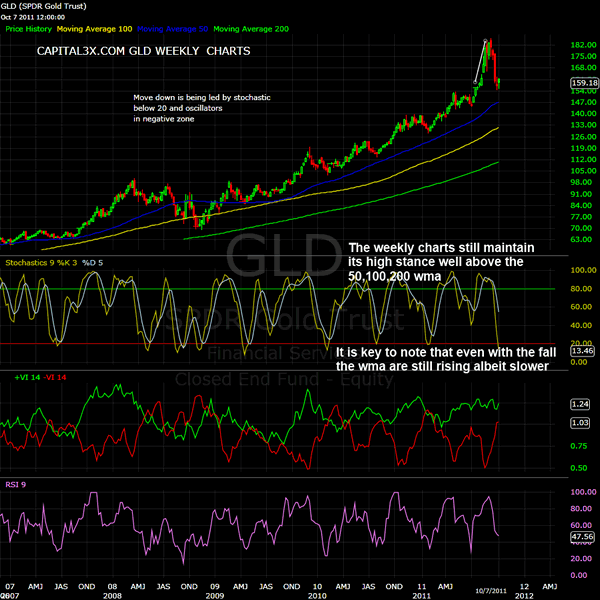
Gold is clearly on a rising line as it is clear of all WMAs. The vortex, Stochastic while moderated are still above levels which are not yet threatening the larger bull move initiated 18 months earlier
The weekly MAs are still rising and therefore indicates a period of consolidation on weekly charts.
Gold in itself has little significance, in a capital market which runs and drives on inter-market relationships. No asset can be looked at in isolation anymore and hence our focus on inter-market.
Gold wrt to SPX Daily
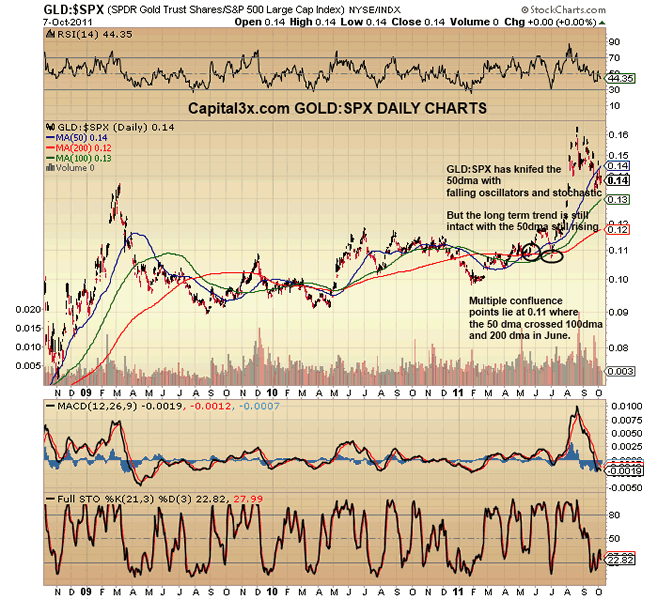
Gold vs SPX has sharply fallen below the 50 dma and hence has been under-performing SPX.The good news though is that the MAs, are still on rising slope and hence we are not entirely sure of Gold underperformance with respect to SPX.
Gold wrt to Dollar Daily
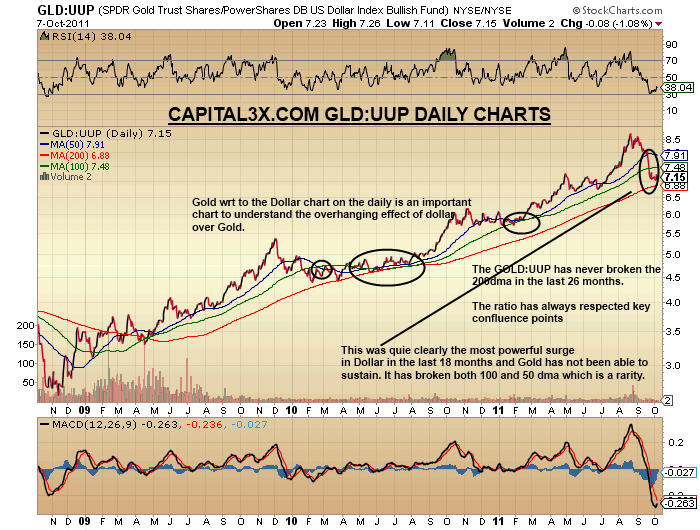
There is a hardly more analysed relation than the Gold Dollar charts. The ratio has now plunged below 100 MA and the support from Oscillators and Stochastic are building the bearish pressure.
GOLD DOLLAR Weekly charts
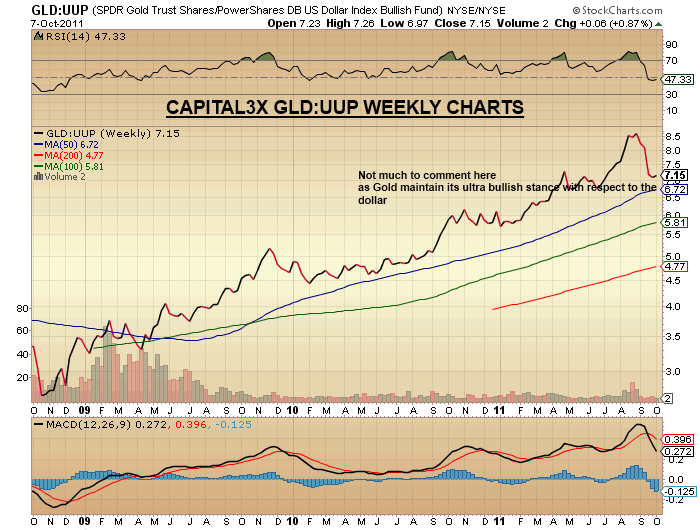
There is a hardly a more analysed relation than the Gold Dollar charts. The ratio has now plunged below 100 MA and the support from Oscillators and Stochastic are building the bearish pressure.
While the daily charts are pointing to zone of strong consolidation with a possible test of the 200dma, the weekly charts are still pointing to gains.
It is vital to note that the 50 dma has started to slant down which will put further pressure on Gold.
Gold and US Treasury 2 Year Yield
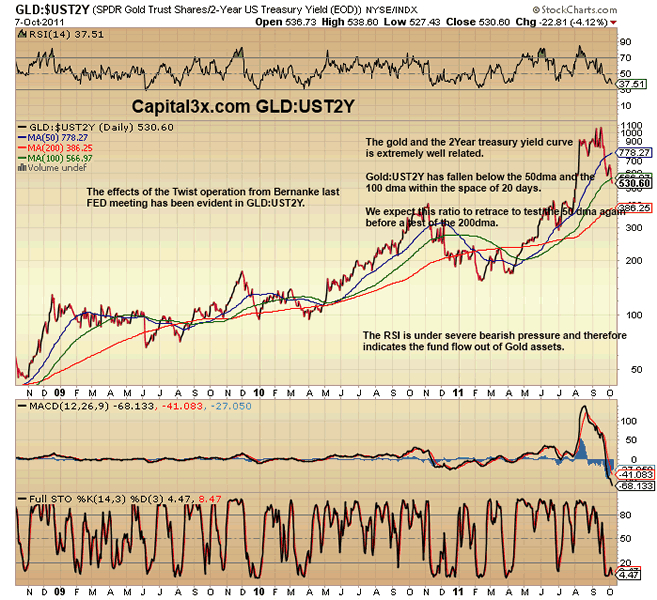
While Gold relation with dollar is important to understand, the dollar itself derives it strength from the US treasury yield curve. Therefore a comparison of Gold to the 2 year yield will provide insights which may be difficult to understand elsewhere. The chart looks anything but pretty. The Gold vs 2 yield has crashed even below the 100 dma thus reflecting the sheer amount of deleveraging in the metals space. The stochastic are at rock bottom while the vortex indicator is in negative territory. The Oscillators too are in negative zone. With such strong bearish pressure, we do not expect Gold to run away in a hurry unless price action suggests otherwise. Banks borrow short term, invest into Gold futures and then market Gold as precious haven and the ensuing rise gives them the quarterly MTM. The Twist operation which so wonderfully evident in the bonds markets and forecasted by us, has put an end to that game.
Gold and Silver ratio
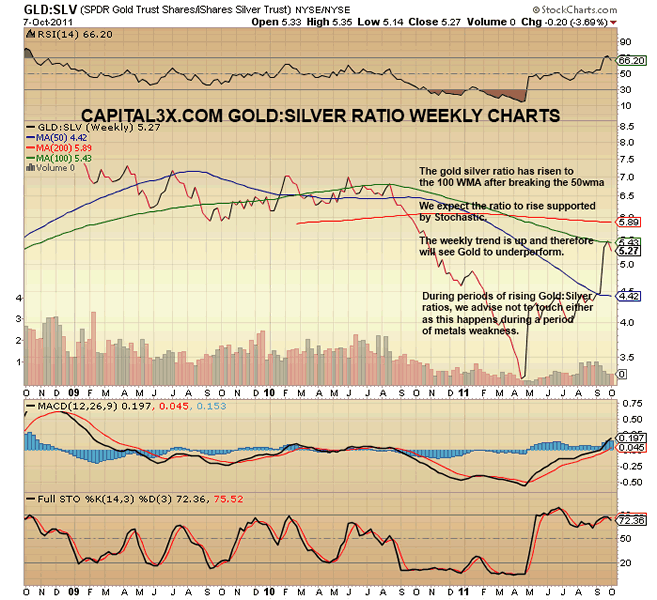
The gold silver ratio is a metric which is quite often used by traders but in itself is not very useful. The best lesson to learn from GLD:SLV chart is that during periods when Gold:SLV rises, it is wise to stay away from Gold. The ratio has zoomed past the 50 WMA and is now challenging the 100 wma.
We do not expect Gold or Silver to outperform the US treasury as yet. The trends are now well established and October may see an extension of all Gold under-performance.
Some of our posts which had caught almost the entire risk aversion trend over August and september:
Sept 9: Dollar King comes to take the Kingdom
Sept 4: The world is slowing
Sept 1: EUR Downfall coming
Aug 28: Has Gold final Lap ended?
Sept 14: USD/CAD pointing to sharp rise
These are only part of the analysis and premium subscribers are constantly updated of new trends from the world of Inter-market analysis.
We continue to watch the price action and will update our premium subscribers with new analysis and charts. Our trade portfolio (Forex, SPX Emini, Crude, Gold, Silver) is visible to our premium subscribers
Our feeds: RSS feed
Our Twitter: Follow Us
Kate
Capital3x.com
Kate, trading experience with PIMCO, now manage capital3x.com. Check performance before you subscribe.
© 2011 Copyright Capital3X - All Rights Reserved
Disclaimer: The above is a matter of opinion provided for general information purposes only and is not intended as investment advice. Information and analysis above are derived from sources and utilising methods believed to be reliable, but we cannot accept responsibility for any losses you may incur as a result of this analysis. Individuals should consult with their personal financial advisors.
© 2005-2022 http://www.MarketOracle.co.uk - The Market Oracle is a FREE Daily Financial Markets Analysis & Forecasting online publication.