


Silver Suspected Bear Pennant Signaling Further Price Drop
Commodities / Gold and Silver 2011 Oct 09, 2011 - 09:34 AM GMTBy: Clive_Maund

 It now looks like we were a little too bullish in the last update, for the way silver has acted over the past week suggests that another sharp drop is imminent before the dust finally settles on this reactive phase, that it likely to take it to or some way below its recent panic lows.
On silver's 4-month chart it is now apparent that a bear Pennant has been forming since the panic bottom, with the weak upside volume portending an imminent breakdown and steep drop. A reader pointed out to me during last week that silver's panic lows occurred in thin trading on the Hong Kong market, and for this reason we do not have to factor in the tail of the "Dragonfly Doji" candlestick shown on the chart when deciding where to draw the boundaries of the Pennant. The measuring implications of this Pennant call for a drop at least to the vicinity of the intraday lows of the Dragonfly Doji and possibly somewhat lower towards the $24 area - at this point the decline should have completely run its course and we will be looking to buy aggressively. We can see that a bearish "Harami" pattern has formed in silver over the past 2 trading days, implying that breakdown from the Pennant and the expected steep drop that will follow is imminent. A reason why this next drop should end the decline is that silver is already deeply oversold as shown by its MACD indicator, and it will of course be even more so after this impending decline. Those interested in going long silver investments in the near future should "keep their powder dry" but stand ready to wade in big time if silver drops into the bright green "aggressive accumulation zone" shown on our chart.
On silver's year-to-date chart we can see that it has suffered 2 massive takedowns this year, that have brought its price back almost to where it was at the start of the year. So why is this?
You may recall that there was much talk earlier this year amongst silver bugs about J P Morgan's massive silver short position, and their cheerleaders encouraged them to believe the fantasy that they could bring down J P Morgan by buying physical silver, as expressed by the picture below which was doing the rounds at the time...
The idea that a mottley bunch of small highly leveraged speculators can bring down an entity like J P Morgan is of course laughably naive, and what in fact has happened is that the big players have turned the tables on the small speculators, by using their leverage and margin against them. They organised the 2 massive silver takedowns, one in early May and other just finished, aided by friends in high places hiking margin requirements, to run them out of their positions, by triggering their stops and margins calls, and then covered their shorts at the resulting low prices. Thus, the latest COT charts reveal that Big Money has largely cleared out of its short positions in silver, which is mega-bullish, with the dramatic drop on the last rout being a sign that we haven't got much further to go before silver reverses, possibly dramatically to the upside, and this is a train that will leave the station without all the get rich quick merchants that were strutting about proudly earlier this year, who will be left behind lying face down in the dirt.
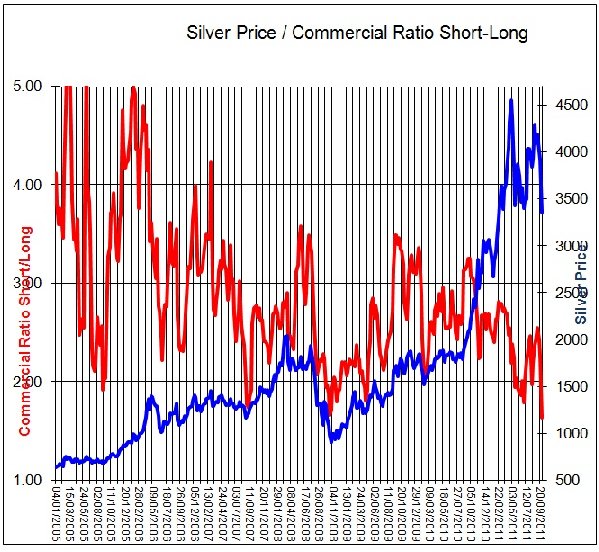
The COT chart above shows an astonishing drop in the Commercials short positions in silver over the past several weeks which is viewed as hugely bullish for the medium and long-term, notwithstanding the expected sharp drop over the short-term. While with this chart some concern could arise over the distortion created by hiked margin requirements, such is not the case with the following chart which has been supplied by Richard Guthrie of The Scarborough Bullion Desk in England, for this is a ratio chart showing the ratio of the Commercials' short to long positions, and as such is immune from such distortion, and as we can see this ratio is NOW AT A RECORD LOW, which is interpreted as hugely bullish, and here we should note that this chart is only up to date as of 20th September and does not include the latter part of the plunge, and so the ratio can be presumed to be at an even lower reading now. The message of this chart is clear - we are now late into the endgame of the transfer of silver assets from weak to strong hands, and that, therefore, the final plunge that is expected shortly should be seized upon as a rare opportunity to go long all things silver - silver itself, silver ETFs, silver stocks, and options for leverage in all of these by those who are qualified by experience to handle the risks involved, at low prices that we are unlikely to see again for a long, long time.
By Clive Maund
CliveMaund.com
For billing & subscription questions: subscriptions@clivemaund.com
© 2011 Clive Maund - The above represents the opinion and analysis of Mr. Maund, based on data available to him, at the time of writing. Mr. Maunds opinions are his own, and are not a recommendation or an offer to buy or sell securities. No responsibility can be accepted for losses that may result as a consequence of trading on the basis of this analysis.
Mr. Maund is an independent analyst who receives no compensation of any kind from any groups, individuals or corporations mentioned in his reports. As trading and investing in any financial markets may involve serious risk of loss, Mr. Maund recommends that you consult with a qualified investment advisor, one licensed by appropriate regulatory agencies in your legal jurisdiction and do your own due diligence and research when making any kind of a transaction with financial ramifications.
Clive Maund Archive |
© 2005-2022 http://www.MarketOracle.co.uk - The Market Oracle is a FREE Daily Financial Markets Analysis & Forecasting online publication.