


Stock Market Beginning of the End
Stock-Markets / Stock Markets 2011 Oct 03, 2011 - 03:12 AM GMTBy: Andre_Gratian

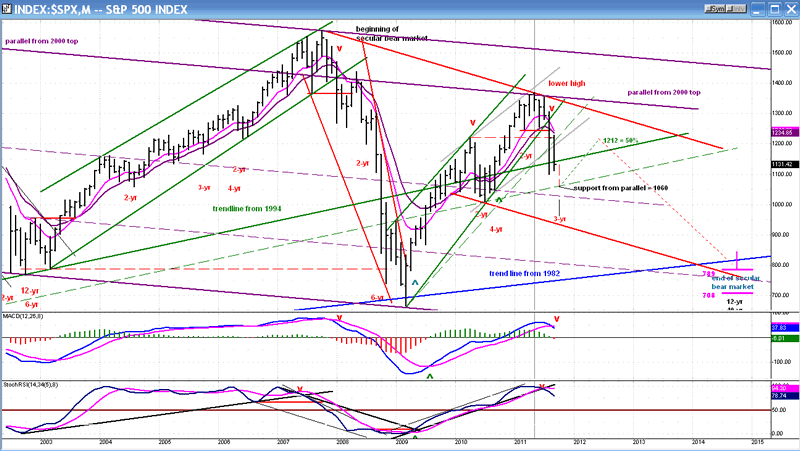
 SPX: Very Long-term trend - The very-long-term cycles are down and, if they make their lows when expected, there will be another steep and prolonged decline into 2014 after this bull market has run its course.
SPX: Intermediate trend - Ideally, the 3-yr cycle is due to make its low next week. This should put an end to the intermediate downtrend and start a new intermediate uptrend.
Analysis of the short-term trend is done on a daily basis with the help of hourly charts. It is an important adjunct to the analysis of daily and weekly charts which discusses the course of longer market trends.
Market Overview
The 3-yr cycle is ideally scheduled to make its low next week and it has brought unrelenting pressure on the market over the past few days. This is why rallies have failed to hold, and why selling is intensifying. We are getting closer and closer to the day of reckoning!
Here is what I wrote in my last newsletter: "The SPX made a double-top at 1220 that created a pattern on the Point & Figure chart from which we can estimate the extent of the decline by taking a count across the 1195 line. We come up with two well-defined targets: One to 1080, and the other to 1040. These are closely correlated by Fibonacci projections. With the 3-yr cycle low about a week away, we could not ask for better conditions to predict the intermediate low."
In our dualistic world, there are two equal and opposite sides to every event: one positive, and one negative. In Asian philosophy, this is known as the yin-yang principle. The bad news about the current market condition is that if everything happens as it "should", the SPX will experience another 80 to 100-point plunge into next week. The good news is that afterwards, it should start another intermediate rally which is likely to last into 2012.
Do not forget, however, that what has transpired in the market since May is most likely only a rehearsal for the next market which "should" take place over the next 3 years! Right now, we are only dealing with a 3-yr cycle. In (October ?) 2014, we will witness the bottoming of the 120-year cycle, a phenomenon that no living human has ever experienced. At this time, it is too early to predict exactly when this grand finale will start, and logic tells us that it will not be 40 times as bad as the 300-point decline from 1370 into next week's suggested low of about 1060, but it should be bad enough. Current estimates are for the SPX to bottom between 700 and 800, but we will have plenty of time to refine this projection.
There is always the possibility that the market will fool us and that the SPX will hold above 1101. If next week fails to bring the significant weakness that is contemplated, bears be careful!
Chart analysis
Just to refresh our memory about the big picture, we'll start by looking at the Monthly Chart of the SPX. The information that I have provided on the chart is self-explanatory, but I'll point out a couple of labels. The Point & Figure projection for the 3-yr cycle low is 1080-1040. This corresponds to the support offered by a parallel to the long-term trend line from 1994 drawn across the July 2010 low.
The other is that we can already make an estimate of the potential extent of the next intermediate rally. If the SPX retraces about 50% of its decline, its uptrend should take it to 1212. Assuming that something of that nature takes place, the price pattern would form the right shoulder of a H&S reversal which started in 2010, and the minimum downward projection of this H&S formation would be about 800, down to the upper final target for 2014.
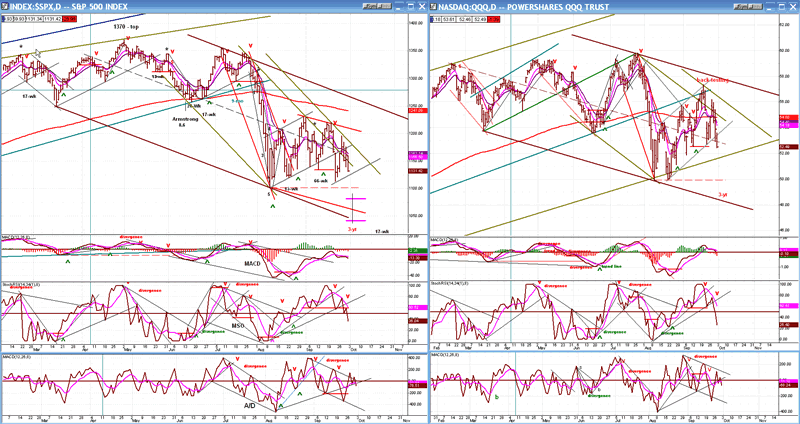
We'll continue with an analysis of the Daily Charts of the SPX and QQQ.
There are several things of importance to note on these charts. The last three days reflect steady weakness in both indices, but more so in the QQQ - which is bearish. I have continually pointed out that, on the long term and on a relative basis, the QQQ showed more strength than the SPX which, historically, has been interpreted as bullish. However, over the near-term, the QQQ has suddenly turned this relationship around and become weaker. This is one indication that there is more market decline ahead. Because of its recent action, I am going to revise my projection of the QQQ down to about 49.00, which will represent a new low.
Another indication comes from the MSO of both charts. They are in a confirmed downtrend and show no sign of bottoming. They could quickly become oversold if we have some severe weakness over the next few days, but will probably have to spend a few more days getting back into a buy position. Can all this be accomplished in a week's time? The A/D indicator (at the bottom) should be the first to give the all clear signal. For the time being, it too is in a downtrend, so we can assume that we are not ready to reverse just yet.
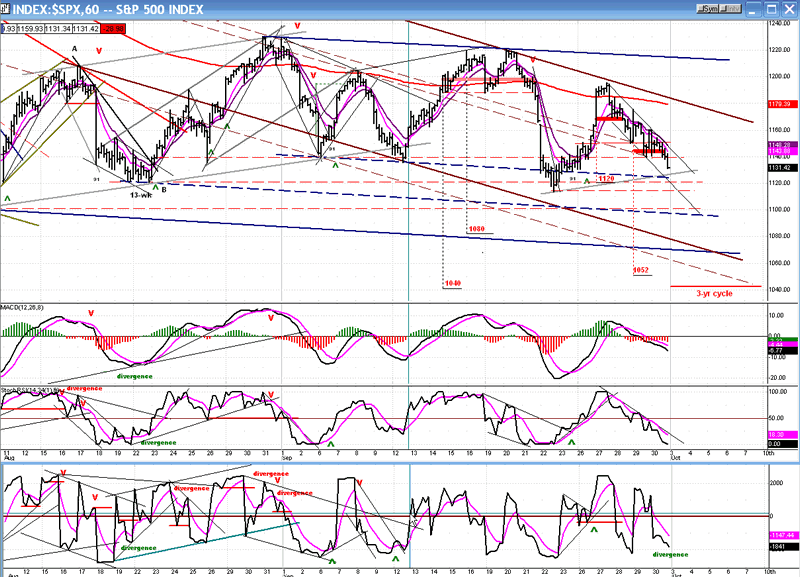
My Hourly Chart is full of trend lines and channels, as usual. They all have meaning (for me) and represent support and resistance levels. The main ones are in bold, and various channels are in different colors so that they stand out. I have also marked several P&F projections and the distribution areas from which they were taken.
Since its last near-term high of 1195, the SPX has come down steadily with only an occasional intra-day rally which only lasted an hour or two, at best. This has created an oversold condition in the indicators and some minor divergence in the A/D. The MACD is also showing some positive divergence although, since the index broke through the 1140 level at the last minute on Friday (and unless it is a false break which is quickly reversed), we may decline to a lower level before finding a final level of support and making new lows.
With the breaking of 1140 -- an important support level which went back to August and had stopped declines and causing rallies before -- we can probably next expect the SPX to go challenge the 1115-20 support levels. There is a small top count to 1120 which might help hold the decline for a while, but even if we did get a bounce from that level, it would probably be short-lived. If the 3-yr cycle does make its low next week (which would be ideal), and especially if the downward projections are correct, there can only be a thin veneer of support left between Friday's close and the index's ultimate destination.
As you can see on the chart, there are several potential lower channel lines which could coincide with the final objective.
Cycles
There is still only one very important cycle left directly ahead, and that is the 3-yr cycle which is scheduled for the end of the first week in October. It could bring a sharp, quick decline to the averages before attempting to send them on to a new recovery high.
Breadth
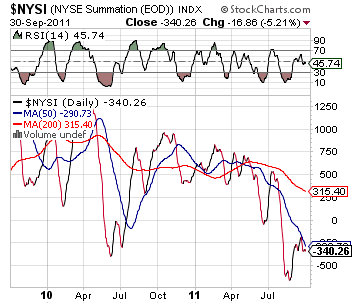
The NYSE Summation Index (courtesy of StockCharts.com) stopped its rally at the 50-DMA and turned down again. It is not likely that it will make it back down to the August low before turning up again while the market makes its final low, setting up the positive divergence typical of a low of an intermediate nature.
Sentiment
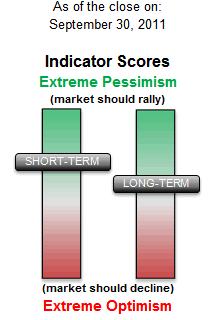
The SentimenTrader (courtesy of same, as the picture at the beginning) does not have much effect on the market unless its long-term indicator is deeply in the green or red. At this point, it would have to be considered essentially neutral and of little predictive value.
NDX:SPX
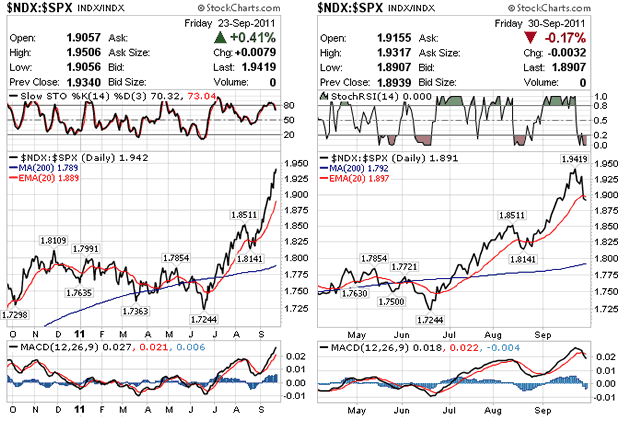
The NDX:SPX ratio (courtesy stockCharts.com) has noticeably deteriorated over the past week. I have consistently pointed out that the QQQ was outperforming the SPX on a long-term basis which, historically, is bullish. This relationship has been reversed over the near-term. As long as the QQQ is leading the SPX on the downside, we can expect more decline.
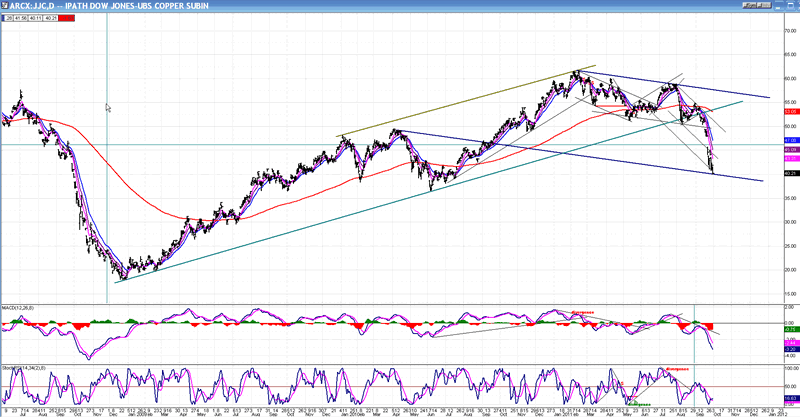
Dr. Copper - A sign of the times
This is (was) the bull market chart of the copper ETF. There should be little debate about whether or not the uptrend is over. We could argue about whether this is only going to be an intermediate correction or something more prolonged, but with major cycles bottoming in 2014, those favoring the latter will most likely be correct.
"As goes copper, so goes the economy". Of course, copper is not the only commodity telling us that economic growth has weakened and that we are probably facing a double-dip recession. All commodities have suffered severe losses and this is reflected in the CRB Index. From a cyclical standpoint, there is a good chance that this will continue for the next three or four years. Can gold move against this deflationary trend?
Summary
My heading "THE BEGINNING OF THE END" refers to the last stages of the bottoming 3-yr cycle. Everything about the stock market is telling us that this is occurring and that it could be over in a week to ten days' trading, but not without more severe price dislocation.
Above, I have given some P&F projections which suggest that the final low could come between 1040 and 1080 on the SPX. We'll let the market give us the final number.
FREE TRIAL SUBSCRIPTON
If precision in market timing for all time frames is something which is important to you, you should consider a trial subscription to my service. It is free, and you will have four weeks to evaluate its worth.
For a FREE 4-week trial. Send an email to: ajg@cybertrails.com
For further subscription options, payment plans, and for important general information, I encourage you to visit my website at www.marketurningpoints.com. It contains summaries of my background, my investment and trading strategies and my unique method of intra-day communication with Market Turning Points subscribers.
By Andre Gratian
MarketTurningPoints.com
A market advisory service should be evaluated on the basis of its forecasting accuracy and cost. At $25.00 per month, this service is probably the best all-around value. Two areas of analysis that are unmatched anywhere else -- cycles (from 2.5-wk to 18-years and longer) and accurate, coordinated Point & Figure and Fibonacci projections -- are combined with other methodologies to bring you weekly reports and frequent daily updates.
“By the Law of Periodical Repetition, everything which has happened once must happen again, and again, and again -- and not capriciously, but at regular periods, and each thing in its own period, not another’s, and each obeying its own law … The same Nature which delights in periodical repetition in the sky is the Nature which orders the affairs of the earth. Let us not underrate the value of that hint.” -- Mark Twain
You may also want to visit the Market Turning Points website to familiarize yourself with my philosophy and strategy.www.marketurningpoints.com
Disclaimer - The above comments about the financial markets are based purely on what I consider to be sound technical analysis principles uncompromised by fundamental considerations. They represent my own opinion and are not meant to be construed as trading or investment advice, but are offered as an analytical point of view which might be of interest to those who follow stock market cycles and technical analysis.
Andre Gratian Archive |
© 2005-2022 http://www.MarketOracle.co.uk - The Market Oracle is a FREE Daily Financial Markets Analysis & Forecasting online publication.