


Are Silver and Copper Prices Predicting a Global Recession?
Commodities / Double Dip Recession Oct 01, 2011 - 05:31 PM GMTBy: J_W_Jones

 Silver and copper have recently been going through their own private bear markets. Since the open on September 1st, silver futures have sold off by more than 25%. During the same time frame, copper futures sold off by around 24%. Both metals are extremely oversold, but lower prices are still possible.
Are the bear markets in copper and silver an attempt to warn market participants that slower economic condition are ahead? Are equities going to take a huge hit on slower future growth?
The notion that lower copper prices will precede a stock market selloff is generally an unfounded allegation. Recently Jason Goepfert of SentimentTrader.com produced the follow table illustrating the returns of the S&P 500 immediately following a bear market in copper over the past 25 years:
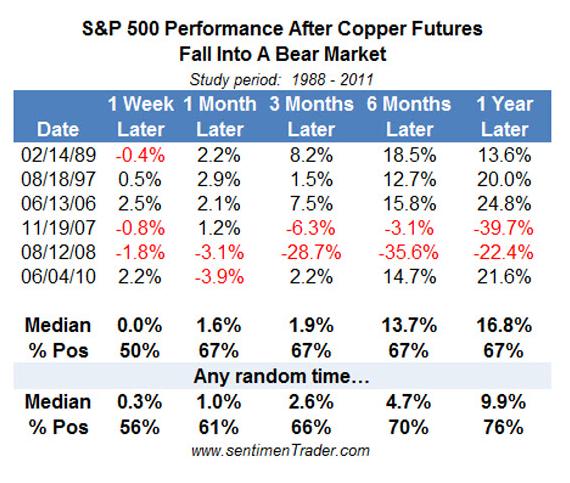
The chart above is additional proof that a massive selloff in copper does not necessarily have a major impact on the returns for the S&P 500. However, I would remind readers that volatility in commodities generally precedes volatility in equities.
Precious metals may be getting close to a possible intermediate term bottom. Silver and copper futures are extremely oversold based on a variety of indicators. However, the key to future price action likely will revolve around the price action in the U.S. Dollar Index.
The U.S. Dollar Index has been ripping higher throughout most of September. The rally in the Dollar is placing pressure on risk assets such as equities, precious metals, and oil. The daily chart of the U.S. Dollar Index is shown below:
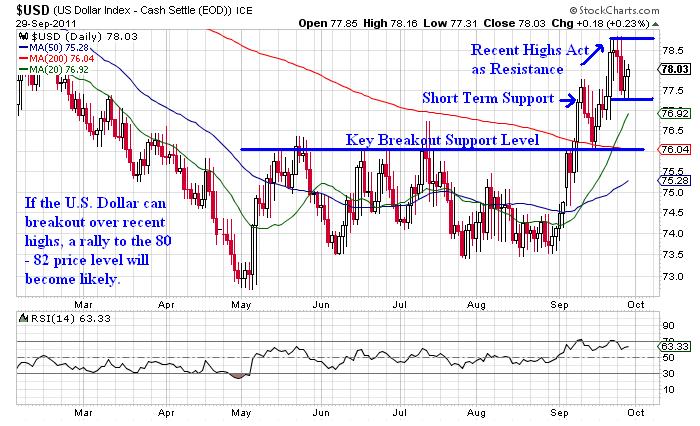
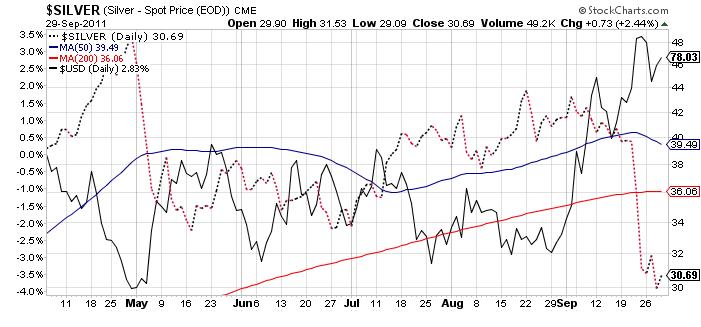
So far the U.S. Dollar Index has been held back by the $79 price level which has been acting as resistance, but if prices can breakout above recent highs it would not be shocking to see the U.S. Dollar Index test the 80 – 82 price range in the near future. A breakout would likely put additional pressure on silver and copper prices. The two charts below illustrate the recent correlation between silver and copper prices and price action in the U.S. Dollar Index:
Silver : Dollar Correlation
Copper : Dollar Correlation
Additionally the S&P 500 could break below the August lows and oil could follow suit if the Dollar continues to work higher above recent resistance. If October turns out to be an ugly month for risk assets as pundits have predicted, then the U.S. Dollar will likely perform relatively well in the intermediate future.
Clearly there is political risk coming from Europe which could alter price action in risk assets in a variety of ways. Financial markets are volatile across the board and large intraday price swings are becoming common place.
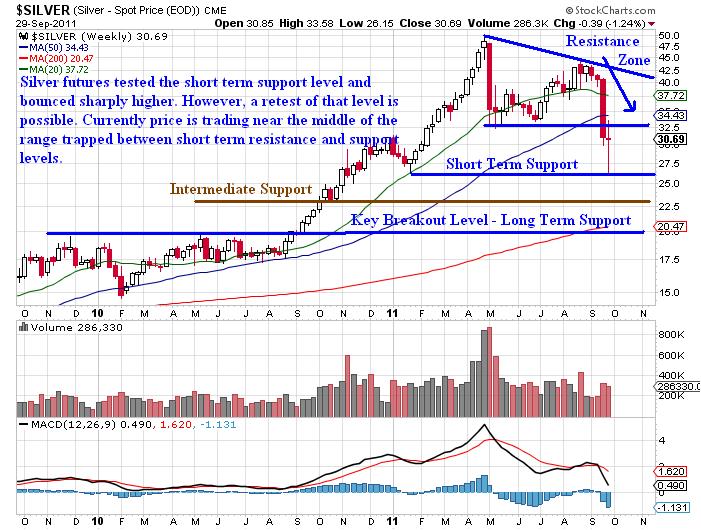
In many cases the headlines will have more impact than the fundamentals or the technicals in this type of trading environment. However, the longer term support and resistance levels should hold sway even during times of exacerbated volatility. The weekly charts of silver and copper futures are shown below:
Silver Weekly Chart
Copper Weekly Chart
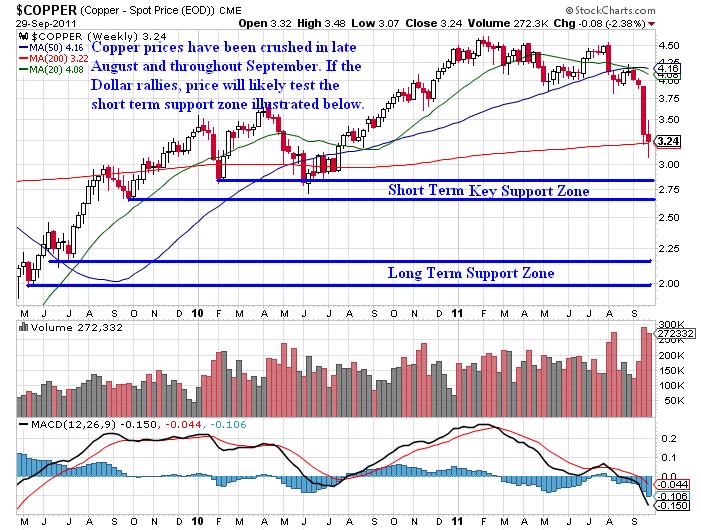
Clearly the price action in silver and copper in late August and throughout September has been ugly. Both metals are oversold in nearly every time frame, however if the Dollar continues to strengthen we could see deeper declines in both silver and copper prices as illustrated in the charts above.
Currently fundamentals and technical analysis cannot be relied upon solely when making trading decisions. However, the longer term support and resistance levels derived from the charts above give informed traders areas that offer solid risk / reward exits for profit taking and entries for those looking to get long silver and copper.
Trading Conclusion:
The data provided above regarding equity returns after a bear market in copper are sufficient enough to state that lower copper prices do not necessarily project lower domestic equity prices in the United States. With that said, the correlation between the price of copper and the IShares FTSE China 25 Index Fund (FXI) is irrefutable. Lower prices recently in copper are directly correlated in the price action of the FXI China Index fund as shown below:
FXI China Index Fund : Copper
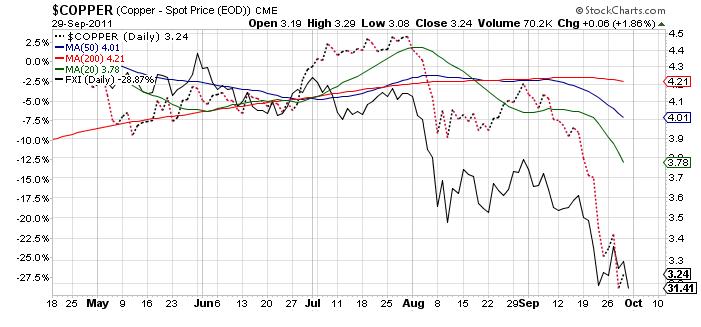
The recent price action in the FXI China Index fund is ugly to say the least. As shown above, if the U.S. Dollar continues to strengthen copper, silver, and the FXI will likely continue to trade lower. Clearly the recent price action in Chinese markets is concerning for domestic equity investors, but an economic statement released earlier today is an ominous signal in the immediate future for U.S. equity investors.
On Friday the ECRI (Economic Cycle Research Institute) came out with a statement that the U.S. economy is headed for a new recession that the U.S. federal government cannot prevent. Data is starting to show signs that a new recession is not only possible, but quite likely in the near future. One of the key underlying assets to monitor for future clues about price action in risk assets is the U.S. Dollar. In coming weeks and months, I will be monitoring the U.S. Dollar closely. I think it would be wise if you did as well. Headline risk is increasingly high!
Review my track record and join now at http://www.optionstradingsignals.com/specials/index.php and receive a 66% off coupon which expires tomorrow.
J.W. Jones is an independent options trader using multiple forms of analysis to guide his option trading strategies. Jones has an extensive background in portfolio analysis and analytics as well as risk analysis. J.W. strives to reach traders that are missing opportunities trading options and commits to writing content which is not only educational, but entertaining as well. Regular readers will develop the knowledge and skills to trade options competently over time. Jones focuses on writing spreads in situations where risk is clearly defined and high potential returns can be realized.
This article is intended solely for information purposes. The opinions are those of the author only. Please conduct further research and consult your financial advisor before making any investment/trading decision. No responsibility can be accepted for losses that may result as a consequence of trading on the basis of this analysis.
© 2005-2022 http://www.MarketOracle.co.uk - The Market Oracle is a FREE Daily Financial Markets Analysis & Forecasting online publication.