Huge Profits In Half Priced Silver, How To Enter Safely
Commodities / Gold and Silver 2011 Sep 26, 2011 - 06:09 AM GMTBy: Bob_Clark

 The metals are under attack by the Fat Boys. Bernanke has made it clear that inflation expectations must be purged from the system before any new stimulus can be started.
The last round of quantitative easing caused speculation in most commodities. The precious metals were major beneficiaries. The experts warned that the bond vigilantes would soon rain hell's fury on the debt markets. It never happened.
Cleansing the system.
What stopped Bernanke and led to this cleansing of the over speculation and the collapse of gold and silver? The food vigilantes. Speculation triggered huge world wide increases in the price of basic foods like grain. That translated into hunger and social unrest around the world. The poor were getting poorer by the day. The Arab spring was not a result of a hunger for democracy, it was simply a result of hunger. Somalia is still struggling with mass starvation.
The fact is, until we cripple the speculators, more monetary stimulation will be self limiting.
It we doubt the plan is to kill the speculators, then we need look no further than what happened on Friday. The margins were raised again on the precious metals futures, right at the time when they are collapsing in price and under full attack from the Fat Boys. The worst thing that can happen to a speculator, is to have a margin increase as prices are collapsing. It is deadly and results in forced liquidation at the worst possible time. Many over leveraged accounts will be wiped out.
More QE.
Working under the basic assumption that ultimately there will be actions taken to keep the economy from falling into a deep depression. We make the second assumption that the measures taken will require a QE3 type of response from almost every country on earth.
We as investors have to make decisions that preserve and grow our wealth.
At some point we have to buy inflation hedges again.
Nasty break.
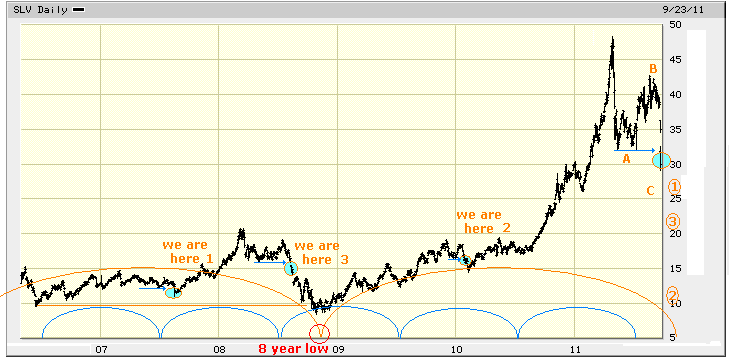
I am going to look at two things today. First in the chart below, I have drawn in a basic 3 year cycle. I have also put in the normal seasonal 1 year cycle. Each year at about the time of point A, which happens in August, we make a low.
We made that low but we have subsequently gone back down below it.
There are only two other instance in the last five years when we have made that low and then broken below it. The big drop we see at the end of 2008 was caused by the dominant 8 year cycle low (for reference you might wish to review my 2009 article, Gold, a recipe for disaster.)
Finding fractals.
On the chart I have marked in the ABC type of decline we are now in and I have pointed out the other instances where we have broken down in a similar fashion. The 2007 and 2008 breaks happened at the same time of year. The 2007 drop is not ideal because of the small shift to the right in the seasonal cycle. It could have just been a minor shift which was measured in days, not weeks like the one in 2008. We are already much later in the current failure (months not days) and it is more similar to the 2008 decline, but this is not an 8 year low. In fact that 8 year cycle should still be in the ascendancy and should not top out until 2012 at the earliest.
I am making the assumption that this is a 3 year low, so we have something to quantify the timing of a key low coming in October. It really doesn't matter what we use. The important thing is that the next low will come in the next month or so. When it does we assume it will be the low for the year.
On the right I have marked my buy targets which I explain below.
One other thing, I am also using the ABC decline we find at the end of 2009 and early 2010 as a control, so I have also marked it with a "we are here". Time wise it doesn't fit, but it did fail to go higher and then broke a previous low.

Choices.
The objective of first identifying and then mathematically analysing the fractals, is to be able to project where silver will bottom on a price basis. When we know that, we can make a trading strategy that allows low risk entries. (I did something similar in the article Gold Price Crash, Deja Vu All Over Again, which you may find helpful as well. In it I called the bottom almost to the tick.)
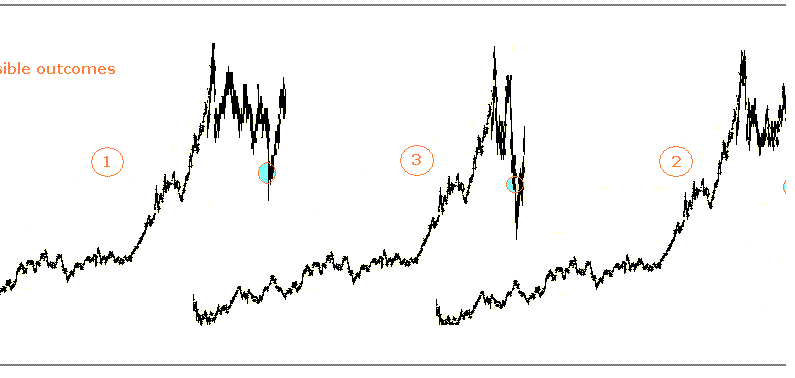
In the chart below I have taken the potential fractals which I marked with numbered "we are here". I modified them mathematically to fit the current pricing structure. I have added them to the high point where we made the last top. So each graphic representation of a fractal is added to the spike that marked the top of the April high. We have projections to several different levels. The first one (1) has just about been reach, in the 27.50 area. To turn up here requires a V bottom to form in the next day or two.
Number 3 which was the control unit because it was not cyclically comparable, projects down to 22.00. We can fall rapidly to that point or we can chop our way down over a week to ten days.
Finally the largest is the one that occurred at the last 8 year low in 2008 (2). It is less likely to be correct this time because it was making a major low at the time, but if you remember that was the last time that the Fat Boys were aggressively attacking the metals. We are replaying that scenario now, so we can't dismiss it.

Probable outcomes.
There is a 1/2 month low due early this week and it will play an important roll in how this correction plays out.
Raising the margins on the metals on Friday tells me that a V bottom forming in the next two or 3 days is not likely. The FBs seem serious about killing the speculators. I expect the next 1/2 month cycle low on Tuesday but its upward influence may not last long and in fact it shouldn't after a break like we just saw.
The thought that we fall all the way back to $11.00 in the current economic environment seems to be less likely. Most analysts expect inflation to continue and I do as well.
That leaves the middle option. More downward push, where the rallies don't get much traction. I think this is the most likely outcome.
How do we trade it?
We can step under the falling piano right here in the $27.50 range but how can you control the risk. We need a stop loss that limits the risk to less than $1.00.
We would be assuming the low we make on Monday or Tuesday is the end of the decline.
It has to be a real V to bottom here, so if we enter and it keeps falling we need to get out fast.
First, let the market turn up and then enter. Put a stop under the spike low. It is not my favorite place to enter but it may work. The problem with this is that if you look at the two previous times it didn't turn immediately after breaking down, there were areas that saw bounces. Those were enough to trap many bottom pickers. Then we went lower. This makes buying here an aggressive trade.
If the first rally attempt fails, we will most likely fall until the next 1 month cycle low. That will take us to the $22.00 level. At $22.00 use the same strategy to try again there. That is assuming you made an earlier attempt. Again it is important to use a stop loss on every trade.
The possibility of number 2 has to be kept on the radar as well. I will be backing up the truck at $22.00 but I will not be riding silver down to $11.00 if my buy trigger gets taken out.
The Fat Boys control the markets and if you are not with them, then you are a victim.
If you are struggling or sitting in cash, I will help you move forward.
First read my archived articles. If you like my track record, then take my course or order my videos.
I have a structured approach to investing that has worked consistently for 20 years. It lets you turn volatility and inflation into wealth.
I teach you how to take tiny risks, to capture big gains.
I have packed a 5 video set with a trading and investing method that works. How well does it work? I teach my course trading with my own money. I have never had a failed student.
Bob Clark is a professional trader with over twenty years experience, he also provides real time online trading instruction, publishes a daily email trading advisory and maintains a web blog at www.winningtradingtactics.blogspot.com his email is linesbot@gmail.com.
© 2011 Copyright Bob Clark - All Rights Reserved
Disclaimer: The above is a matter of opinion provided for general information purposes only and is not intended as investment advice. Information and analysis above are derived from sources and utilising methods believed to be reliable, but we cannot accept responsibility for any losses you may incur as a result of this analysis. Individuals should consult with their personal financial advisors
© 2005-2022 http://www.MarketOracle.co.uk - The Market Oracle is a FREE Daily Financial Markets Analysis & Forecasting online publication.
Comments
|
Bob Clark
01 Oct 11, 12:41 |
missing chart
I see the fractal chart got cut off in this article. I have posted it on my blog. http://winningtradingtactics.blogspot.com/ Bob |


