Stock Market Intermediate Support Breached
Stock-Markets / Stock Markets 2011 Sep 26, 2011 - 02:10 AM GMTBy: Andre_Gratian
 SPX: Very Long-term trend - The very-long-term cycles are down and, if they make their lows when expected, there will be another steep and prolonged decline into 2014 after this bull market has run its course.
SPX: Intermediate trend - Back to square one, with a good possibility that the 3-yr cycle will bring a new low. It already has for some other indices.
Analysis of the short-term trend is done on a daily basis with the help of hourly charts. It is an important adjunct to the analysis of daily and weekly charts which discusses the course of longer market trends.
Market Overview
In my newsletter of September 11, I mentioned that the market was just about ready to fall off a cliff. I am not sure if this was the proper analogy but, after a 10-day reprieve, and using the Fed report of September 11 as an excuse, prices broke sharply with some indices already trading at new intermediate lows. I believe that the real reason behind this move is the bottoming phase of the 3-yr cycle and, since its low is not due until the first week in October, we are not likely to see the completion of the current intermediate decline before that date.
The SPX made a double-top at 1220 that created a pattern on the Point & figure chart from which we can estimate the extent of the decline by taking a count across the 1195 line. We come up with two well-defined targets: One to 1080, and the other to 1040. These are in close correlation with Fibonacci projections. With the 3-yr cycle low about a week away, we could not ask for better conditions to predict the intermediate low, both in price and time.
The SPX, along with a few other indices, has not yet broken below the August low, but it's surely only a matter of time before it does. Some averages usually lead the rest and they can be helpful in forecasting reversals. The Russell 2000 has that reputation and, in retrospect, it did give a small warning when the SPX made a double-top at 1220 and it did not. On Thursday, it broke its low of 8/09 by a small margin while the SPX remained well above. This is probably another indication that new lows are ahead, especially with about another week to go into the cycle low. In any case, I started searching for a leading index that has better predictability than the Russell, and I believe that I have found one that exceeds it, not only in predictability, but excels in consistency as well. Its current technical condition definitely suggests that new lows are still ahead.
At Friday's close, this lead indicator was essentially near-term neutral, probably because the market will be moved by what comes out of the G-20 meeting this week-end. I am still trying to find the best way to analyze it and on what time frame. For instance, is the warning of a reversal clearer on a daily chart, an hourly chart, or even on a 5-m chart? And is it better evaluated strictly on a divergence basis, or by using Fibonacci projections and retracements? After I have had a chance to evaluate this further, I am sure that I will have gained another very powerful forecasting tool.
Last week, I showed a chart of the Dow Jones Composite. After one more week of trading, it looks essentially the same and has remained above its August 9 low. If the SPX should correct to 1040, the current price ratio between the two indices would put the Composite at about 3400, well above its July 2010 low, and still well within the confines of its up channel. In other words, still in an uptrend, technically, but with the very long cycles bearing down into 2014, it's probably only a matter of time before a confirmed reversal occurs.
One more point before we look at charts, I do not expect QQQ to make a new low, but to end its decline around 51.50 or higher.
Chart analysis
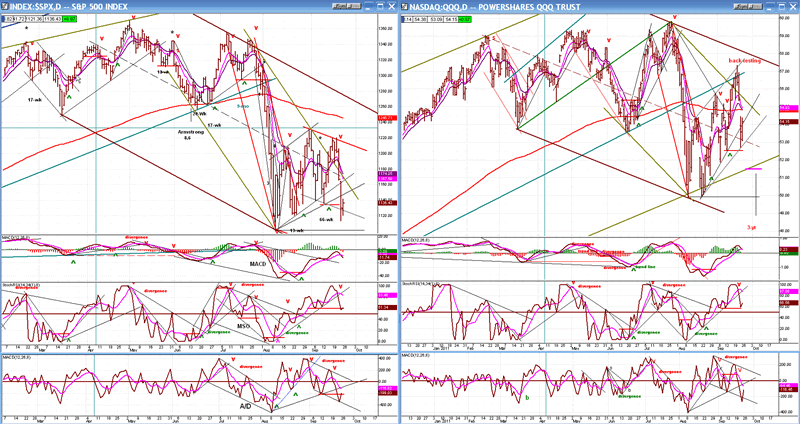
We'll start with the Daily Charts of the SPX & QQQ. The charts themselves are only roughly similar, because the QQQ is much stronger relatively to the SPX. This is why I do not expect it to make a new low in early October.
The indicators are similar, with the only noticeable difference being in the MACD of the QQQ which is stronger than that of the SPX. Collectively, they show a trend which is reversing and which has farther to go. The uptrend lines have been broken and, as usual, the A/D is making a series of lower lows. As a result of the holding pattern on Friday, the indicators have turned up slightly and the MSO of both indices have held at their former low. This could be a sign that Monday will be an up-day which shows up better in the hourly charts. However, Art Cashin, the 50-yr veteran trader on the floor of the NYSE who is a reputed stock market historian as well as a shrewd analyst, warns us to be cautious of the Thursday-Monday syndrome. A lot of weakness on Thursday is often followed by a period of stabilization on Friday, and then the weakness returns with a vengeance on Monday, often bringing about a selling climax which precedes a sharp rally.
So, could we see a 60-point drop to 1080 on Monday, followed by a rally, and then the onto the final low of 1040 in the first week of October? Sounds very plausible to me!
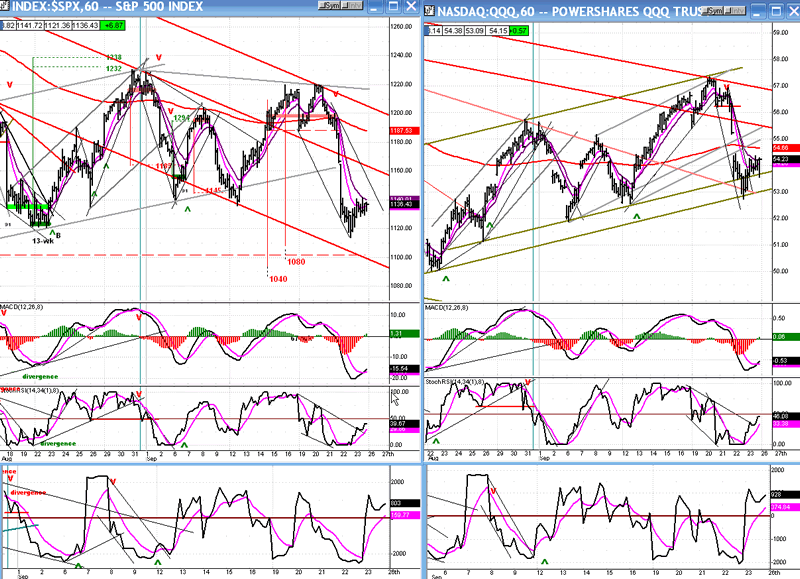
Now, for the Hourly Charts. Here also, the relative strength of the QQQ is obvious, and I don't expect it to penetrate the 50.00 level.
On the SPX chart, I have marked the double top distribution level with a red bar and shown the resulting P&F projections: 1080 and 1040.
The indicators started moving up on Thursday, as prices began to stabilize. As of Friday's close, they remain in an uptrend but, by certain standards, the SPX has not yet given a near-term buy signal, while the QQQ has -- but barely. Whether we'll extend the bounce on Monday or suffer a repeat of the Thursday-Monday syndrome is anyone's guess. We may get a hint from the Globex futures, late Sunday afternoon.
Cycles
There is only one very important cycle left directly ahead, and that is the 3-yr cycle which is scheduled to make its low in the first week of October. It could bring a sharp, quick decline to the averages.
Breadth
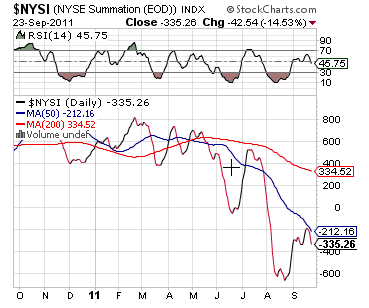
The NYSE Summation Index (courtesy of StockCharts.com) stopped its rally at the 50-DMA and started to turn down again. It is likely that it will not make it back down to the August low before it turns up again while the market makes its final low, thereby setting up the positive divergence which is typical of a low of intermediate nature.
Sentiment
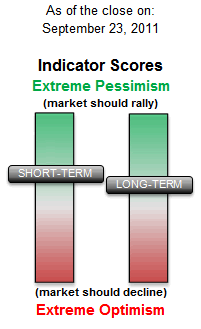
The SentimenTrader (courtesy of same, as is the picture at the beginning) does not have much effect on the market unless its long-term indicator is deeply in the green or red. Since there has been surprisingly little movement in its level in spite of the market weakness, its position tells us that we have probably not reached the bottom of the decline.
NDX:SPX
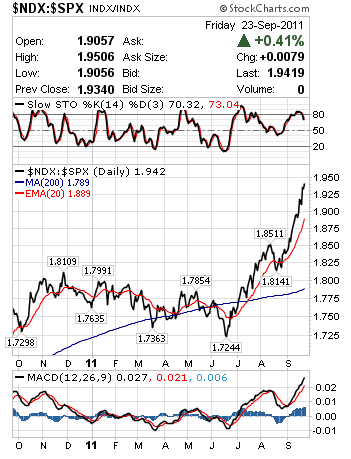
The NDX:SPX ratio (courtesy of StockCharts.com) should continue to give those who have a long-term investment in QQQ hope and comfort that it is likely to recoup much of its loss after the market makes its low. As for its ability to predict market tops, we'll just have to wait and see what it is telling us, and if it is anything of importance. Certainly the MACD (at the bottom) is still going up sharply, as is the index, with no sign of reversal in sight. Perhaps this is more about the future performance of AAPL and GOOG than that of the market as a whole!
GOLD
This is a Daily Chart of GLD, the gold ETF:
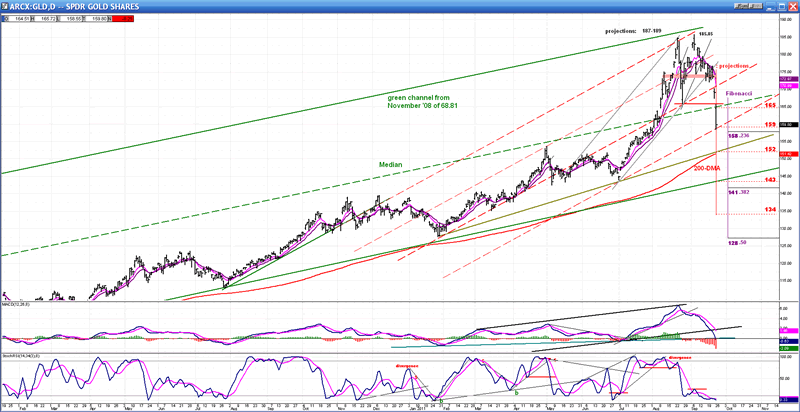
In my newsletter of August 28, I did a thorough analysis of gold. It started with: "Gold appears to be at an important juncture, and this calls for a detailed commentary". I warned that GLD had an important projection to 187-189, and that this could turn out to be the end of the uptrend which started at its November 2008 low of 68.81. My forecast was spot on, and if you wish to review it, go to www.marketurningpoints.com, click on "Newsletters", and bring up the August 28 issue.
Let's see what has transpired since: gold often finishes an important move with a climactic thrust. This is what has happened here. GLD only came slightly short of its Point & Figure count of 1187-89 and, judging by its reaction since then, it has started an important corrective phase. The index has already quickly dropped to 159, which was both a P&F phase projection and a 23.6 retracement. If this were a normal correction, it would probably stop there and continue its uptrend. But it is only the beginning of something more serious.
On the chart, I have marked the downside P&F projections derived from the distribution top (red bar), as well as the Fibonacci retracement levels which normally correspond to a corrective move. Those where both price levels coincide (such as 158/159) are the ones which stand the best chance of being reached. The next price levels where this occurs is 141/143, and this is where I would expect the correction to take GLD before it is potentially over. That does not mean that it can't go lower to 134, and perhaps even 128, but the odds favor 141/143.
Note that there is a phase projection to 152 which corresponds to the level of the 200-DMA. If GLD decides to move beyond 159 right away, this is likely to be its next target, and it should prove to be a good support area.
It's too early to make any kind of forecast beyond these price objectives. It may be that gold has found a major top instead of an intermediate one, but this can only be decided much later.
Summary
Last week, the stock market took a turn for the worse, which was not that much of a surprise since it was not just a matter of IF it would continue its downtrend into the 3-yr cycle low, but by HOW MUCH.
A mild correction would have kept prices above the SPX 1101 level. However, this is apparently not what is in store. Some indices have already fallen below their early August lows, and others - including SPX - should soon follow. SPX has a good P&F projection to 1080-1040.
The bottom of the 3-yr cycle in the first week of October is likely to mark the end of the intermediate trend which started at 1370, and to bring about the start of a secondary reaction in a bear market. It could be sharp and extensive. We'll be better able to gauge it
FREE TRIAL SUBSCRIPTON
If precision in market timing for all time frames is something which is important to you, you should consider a trial subscription to my service. It is free, and you will have four weeks to evaluate its worth.
For a FREE 4-week trial. Send an email to: ajg@cybertrails.com
For further subscription options, payment plans, and for important general information, I encourage you to visit my website at www.marketurningpoints.com. It contains summaries of my background, my investment and trading strategies and my unique method of intra-day communication with Market Turning Points subscribers.
By Andre Gratian
MarketTurningPoints.com
A market advisory service should be evaluated on the basis of its forecasting accuracy and cost. At $25.00 per month, this service is probably the best all-around value. Two areas of analysis that are unmatched anywhere else -- cycles (from 2.5-wk to 18-years and longer) and accurate, coordinated Point & Figure and Fibonacci projections -- are combined with other methodologies to bring you weekly reports and frequent daily updates.
“By the Law of Periodical Repetition, everything which has happened once must happen again, and again, and again -- and not capriciously, but at regular periods, and each thing in its own period, not another’s, and each obeying its own law … The same Nature which delights in periodical repetition in the sky is the Nature which orders the affairs of the earth. Let us not underrate the value of that hint.” -- Mark Twain
You may also want to visit the Market Turning Points website to familiarize yourself with my philosophy and strategy.www.marketurningpoints.com
Disclaimer - The above comments about the financial markets are based purely on what I consider to be sound technical analysis principles uncompromised by fundamental considerations. They represent my own opinion and are not meant to be construed as trading or investment advice, but are offered as an analytical point of view which might be of interest to those who follow stock market cycles and technical analysis.
Andre Gratian Archive |
© 2005-2022 http://www.MarketOracle.co.uk - The Market Oracle is a FREE Daily Financial Markets Analysis & Forecasting online publication.


