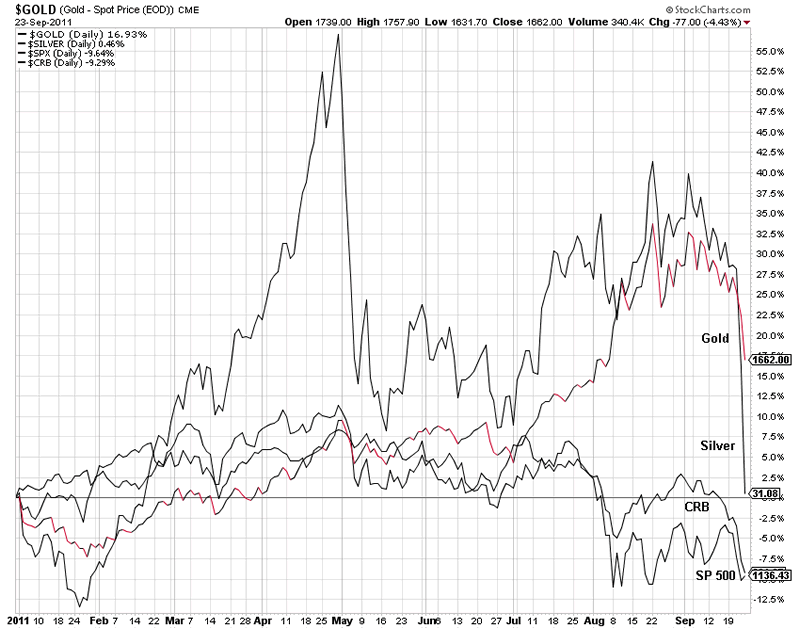
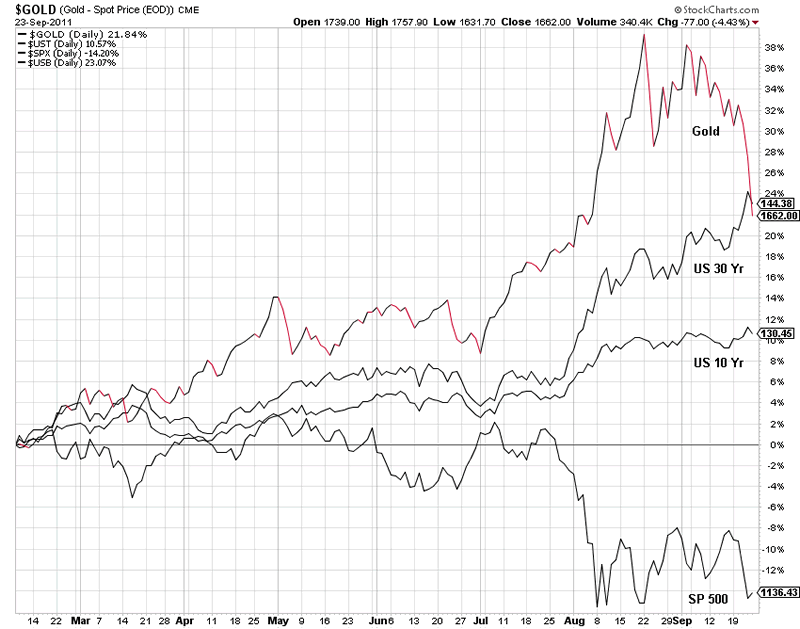
Year-To-Date Performance of Various Financial Assets
Stock-Markets / Financial Markets 2011 Sep 25, 2011 - 11:54 AM GMTBy: Jesse
Check out the Treasuries in the second chart, particularly the 30 Year Bond.
If the Fed had not been targeting assets to create some of these price moves it would be the best case for deflation which I have seen thus far.
I think this might be a case in which Fed does something with the right hand, which the audience is watching, while it does something very different with its left hand, using the misdirection of the markets to distract the viewers from its true purposes.
Whatever that may be, the performance is what it is. It shows no recovery in the real economy and an expansion of the 'financing sector.'


By Jesse
http://jessescrossroadscafe.blogspot.com
Welcome to Jesse's Café Américain - These are personal observations about the economy and the markets. In providing information, we hope this allows you to make your own decisions in an informed manner, even if it is from learning by our mistakes, which are many.
© 2011 Copyright Jesse's Café Américain - All Rights Reserved
Disclaimer: The above is a matter of opinion provided for general information purposes only and is not intended as investment advice. Information and analysis above are derived from sources and utilising methods believed to be reliable, but we cannot accept responsibility for any losses you may incur as a result of this analysis. Individuals should consult with their personal financial advisors.
© 2005-2022 http://www.MarketOracle.co.uk - The Market Oracle is a FREE Daily Financial Markets Analysis & Forecasting online publication.


