


Markets Bloody September, Fed Twist Reimposed our Intermarket Analysis
Stock-Markets / Financial Markets 2011 Sep 23, 2011 - 02:00 AM GMTBy: Capital3X

 Bernanke has played a smart move here as he moves into the Twist operation. Effectively he has killed the game in the town: Borrow short and invest long term/play the commodities game. By announcing an intention to sell short curve, FED has now signaled its desire to bring down commodities in a heap. It is a one handle move to strangle speculative bank/hedge fund positions. Will there be a systemic crisis? Am not yet sure but I think the FED would have thought about this.
Now once he has seen the equity and commodities classes to have corrected *adequately*, I believe, there will be a strong case for QE in Nov citing the slowdown and fall in equity prices. Bernanke may even be lauded for his efforts to curb speculative borrowing by doing Twist operation in Sept and not doing QE till the time it was really required.
We believe over the next few weeks, Gold and copper and all leveraged classes of asset will take a beating like not seen since 2008. The herd of investment funds will then join towards the end of the crash only to be left holding the baton at the end of the move.
We warned about the crash in Sept in this article:
Bloody September coming
Then more recently we looked at the CRB index to draw further conclusions that we are headed lower given the tight correlations. SPY is just a index and there is no point charting waves over it. It is defined by the underlying intermarket connections and therefore all the more important to understand the underlying correlations which is what we do at Capital3X.
These are all premium analysis and therefore are updated first for premium subscribers. Premium subscribers also get to trade our portfolio of FX,COMMODITIES. Just in Sept, they have made +2300 pips over 70 trading calls.
Vix charts have bounced off 50 dma with powerful wave of Oscillators and stochastic giving credence to this move.
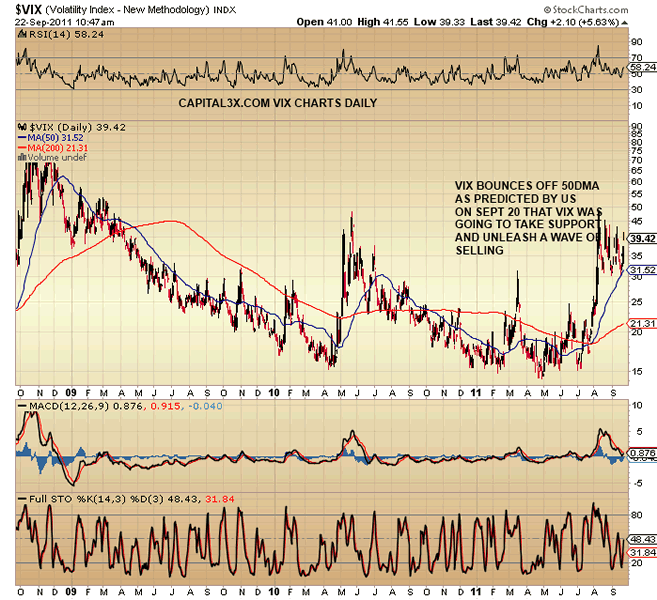
We warned our subscriber on Sept 19 that VIX was only consolidating and about to turn back from 50 dma which was exactly what it did.
Analyzing the metals charts we see the break of support.
Metals charts (Daily)
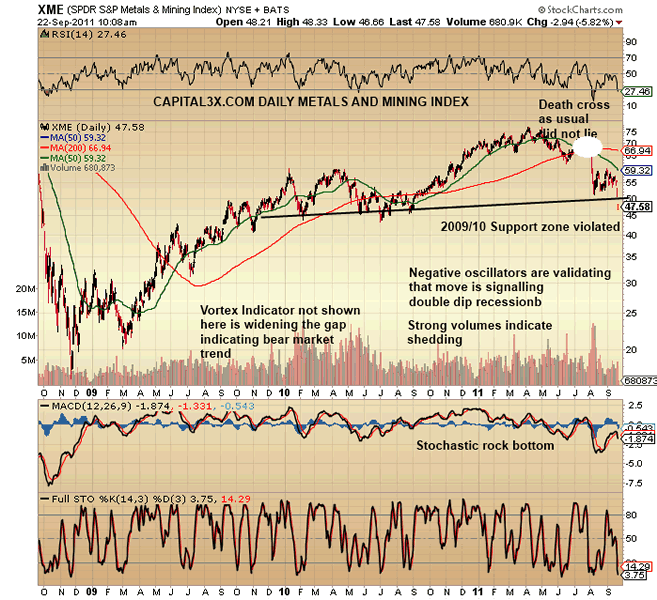
The daily charts have clearly broken down support with vortex indicator in negative zone pointing to further losses.
On a weekly basis, the trend is now down.
Metals charts (Weekly)
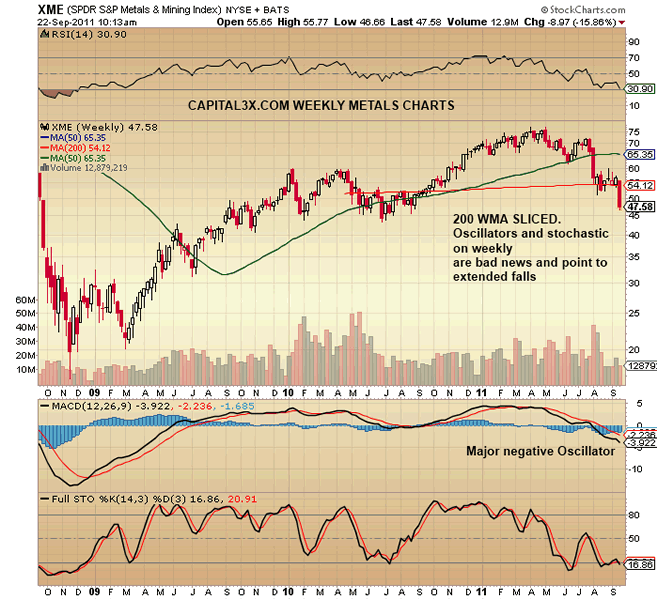
On weekly charts, the longer trend is now to the downside with massive downside risks.
Metals: SPY Ratio charts (Ratio Charts)
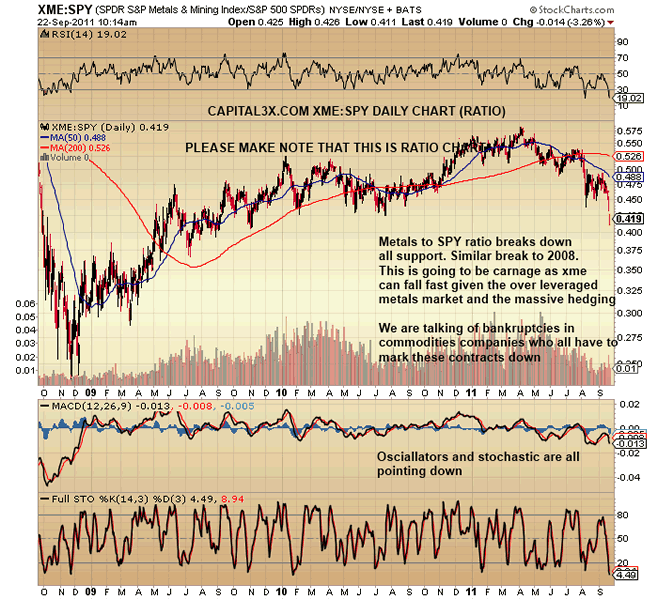
The Metals to SPY ratio chart has broken down key levels with trend lines broken and Vortext indicator pointing to further steep losses coming.
While the commodity markets are swathed in blood for a few weeks (Warned by us more than 10 days back to premium subscribers) the treasury markets are in a blow out stage (long curve of treasury) while the short treasuries are slowly moving down to breakdown. It could add further losses to equity and commodity markets.
US 3 YEAR TREASURY BOND charts (Daily)
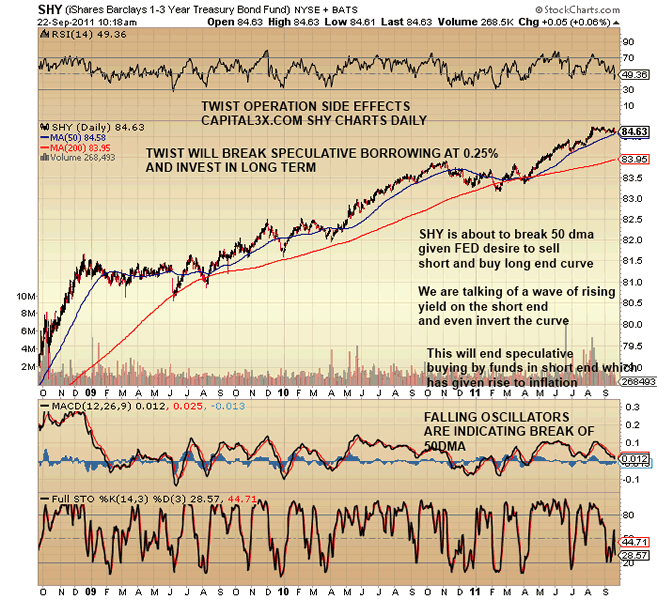
The 3 year bonds are about to break down as banks join the FED in selling their portion. This will increase the yield on the short term and therefore making it far more expensive to borrow short term which is generally used by speculative players to invest into commodities.
US 30 YEAR TREASURY BOND charts (Daily)
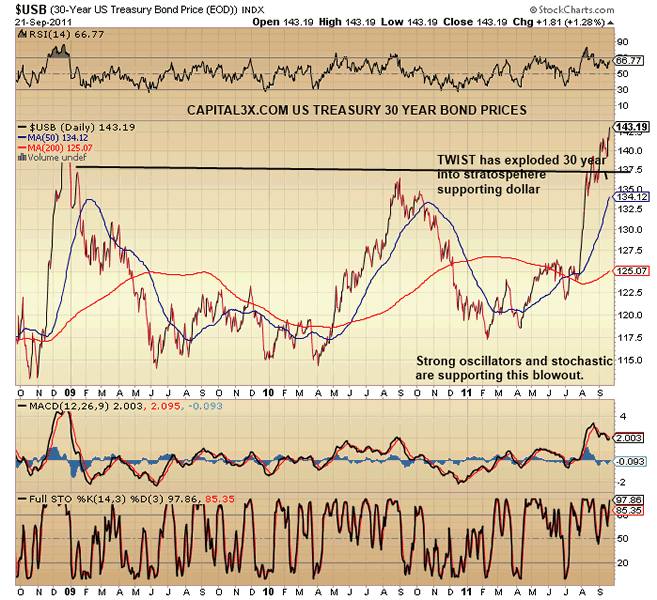
So while the short term bonds are breaking support and about to induce a wave of de-leveraging across assets, the 30 year which supports the dollar has broken out. As we said above, the FED knows what it is doing. This is a deliberate aim to curb commodities more than anything. They need to inject capital into the economy but cannot do so until they have asset inflation under control.
Gold:TLT ratio charts (Daily)
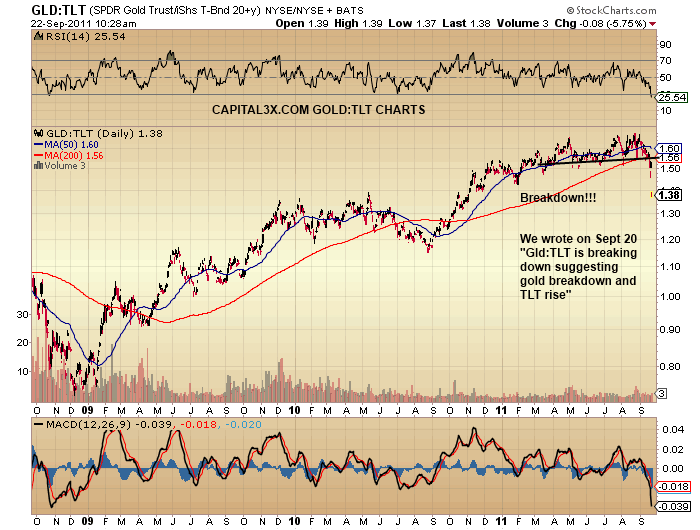
The GOLD:TLT ratio (which is the GOLD prices to 20 year bond prices) have broken down key support levels. Oscillators and stochastic are pointing to further falls. We warned about this here
Therefore the intermarket analysis pointed to us that Gold was about to break down from 1775 levels even while analysts were churning out buy on Gold. (Another reason to look to intermarket analysis at Capital3x.com?)
Dollar Daily charts
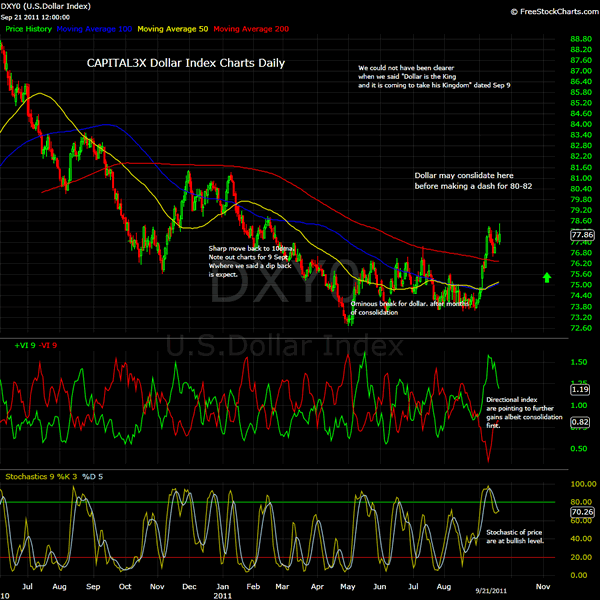
On the daily charts, DXY has broken in to an outright run but we also believe that we will see dollar stabilizing at these levels as we enter October before another move. The oscillators are now strongly advocating bullish moves while stochastic are resting at 70 levels. The direction indices are also pointing to bullish moves. However the pace of dollar move should now wane. ADX has moved to above 40 levels thus helping the trend.
Dollar Weekly charts
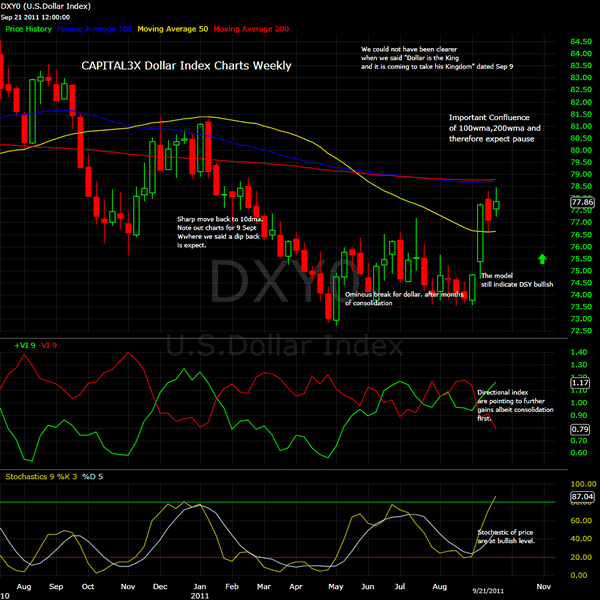
On the weekly charts, dollar, has now reached an important confluence point of the 100wma, 200wma and 50 wma. The 100 and the 200 are converging at the same point of 78.6 levels which is the level from which dollar paused.
CRB Index
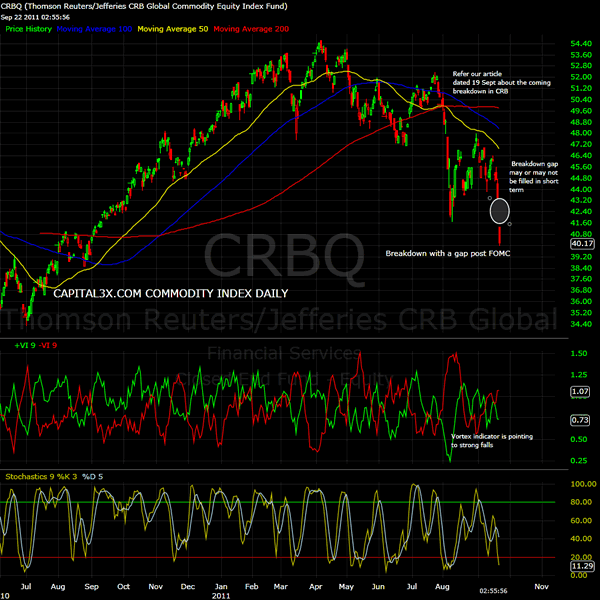
The commodity equity index has broken through all support zones as warned by us here on 19 Sept 2011 of the coming blood bath. Our subscribers were well in knowledge of the coming rout even while chartists were pumping in bullish views about a SPY break of 1220.
GOLD CHARTS DAILY (ISOLATION)
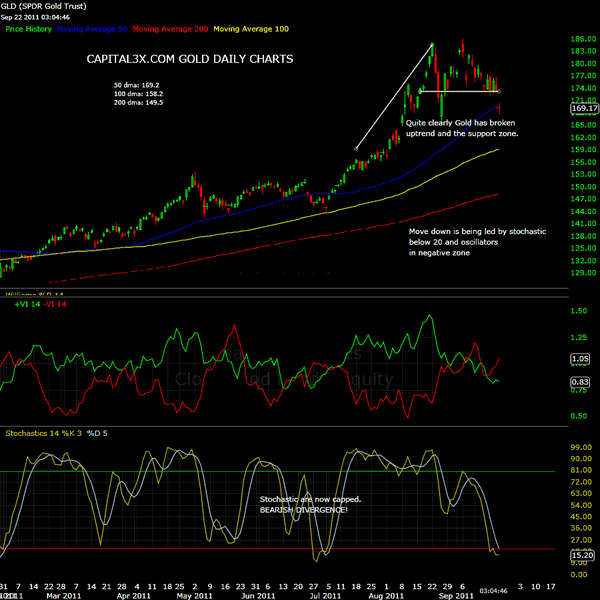
Gold has knifed through 50dma. Expect a bounce back to close out the gaps but we have clearly now pierced the 18 months uptrend. This is why we believe Gold is just as leveraged as any other asset. By one stroke, Bernanke killed the entire asset inflation train or at least made an effort. Gold was a direct result of the short curve borrowing existent over the last 2 years. A must analyse are the inter market charts on Gold and 30 year bond prices and how they have broken support which implies large downside for Gold. They are provided here.
We will be posting more analysis and updates as we go along.
Premium subscribers can login and check the latest trading portfolio for 5 September
Our feeds: RSS feed
Our Twitter: Follow Us
Kate
Capital3x.com
Kate, trading experience with PIMCO, now manage capital3x.com. Check performance before you subscribe.
© 2011 Copyright Capital3X - All Rights Reserved
Disclaimer: The above is a matter of opinion provided for general information purposes only and is not intended as investment advice. Information and analysis above are derived from sources and utilising methods believed to be reliable, but we cannot accept responsibility for any losses you may incur as a result of this analysis. Individuals should consult with their personal financial advisors.
© 2005-2022 http://www.MarketOracle.co.uk - The Market Oracle is a FREE Daily Financial Markets Analysis & Forecasting online publication.