


What Crude Oil Is Telling Us About Stock Market SPY?
Stock-Markets / Financial Markets 2011 Sep 19, 2011 - 10:33 AM GMTBy: Capital3X

 Crude and SPY are as intimately woven as anything else. They have probably one of the best regression coefficients with the equity indices (esp SPY) and thus highlighting the multi asset pull of Bernanke QE moves.
We analyse crude daily, weekly and monthly charts and the proceed to understand the love relationship between SPY and Crude. Finally we will look at crude fundamental given that SPY rarely does not track crude in the medium term.
We will then close the discussion with charts on CORN and CRB index which are vital to understand the market moves.
CRUDE DAILY CHARTS
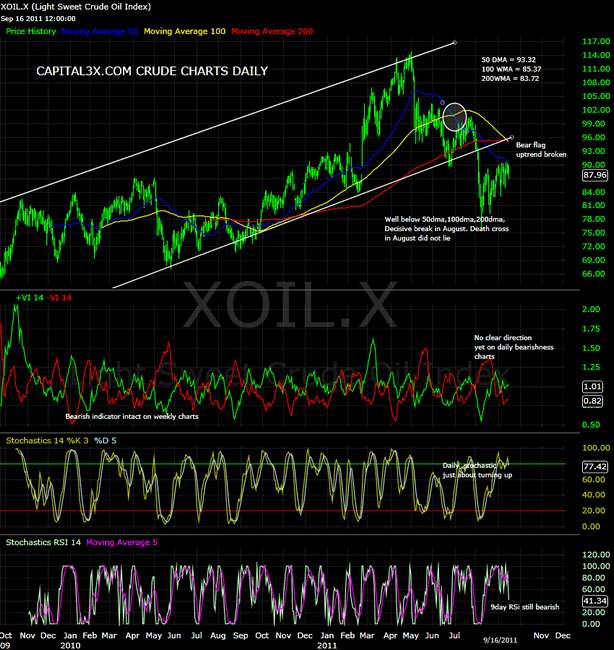
On the daily charts crude has broken through the uptrend extending from 2009 onwards. Mnay would call that giant bear flag which when broken is signifying a significant drop unless we see it shoot back into the channel.
To suggest a coming back into the channel logic, stochastic are now pointing to a sharp move while the bearishness index has now marginally broken into the positive with the green vortex (14 day) is well above the red vortex. The 14 RSI is pointing downwards but RSI is lagging indicator and hence can change.
Crude Weekly Charts
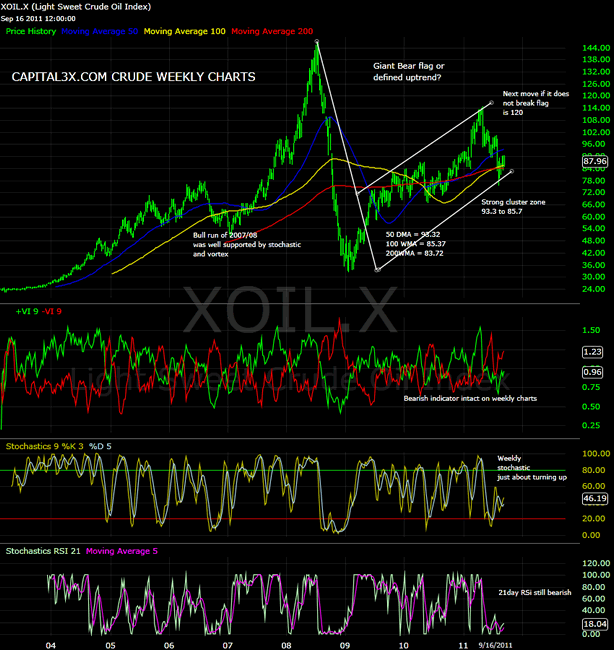
On the Weekly charts, crude is looking quite weak with weak stochastic (9 week) and bearish vortex with the 9 week vortex pointing us to further weekly loses. The 21 week RSI is depressed at 21 levels for the longest period of time since Oct 2008 which can only mean that there are further unwinding left on the weekly charts.
The direction for a long term trader (As indicated by the weekly charts is quite clearly downwards).
Crude Monthly vs SPY Monthly Correlation
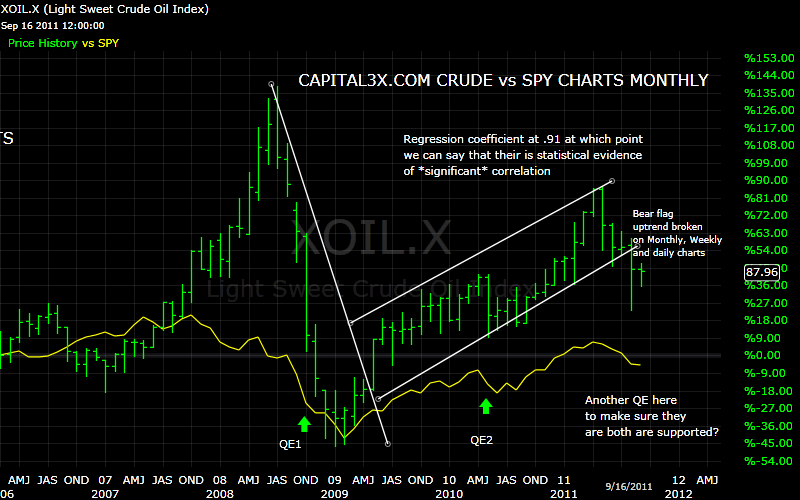
A key chart indicating the intense relationship between various asset classes across the world, is the SPY Monthly and the Crude Monthly Charts. There is 91% regression coefficient from 2006-2011. The regression only increased after both the QEs which only goes to prove the dangerous FED moves to pump in liquidity which is only ending up pulling assets classes up while doing no great benefit for the real economy.
Fundamentally speaking crude is looking weak as never before:
Fundamental Analysis
Iraq international relations have been improving. In April 2011, Iraq supplied South Korea with emergency Oil and thus once again capping and demand based oull in the Oil market.
The latest Reuters reports reveal that South Korea has signed a new crude oil deal with Iraq for the provision of at least 250,000 barrels per day (bpd) in an emergency situation.
The S. Korean ministry of knowledge economy announced that the deal is equivalent to 10% of the country’s 2.4m bpd crude oil imports.
They have also inked agreements with India and China, among the largest Asian crude importers and therefore once again capping Oil prices. It is no secret that US investment banks are sitting on massive oil longs and are desperate to unload them. A recent report by JPM suggested the crude was about to do 2008 kind of burst and ended up falling below the 200wma.
On IRAQ supply improvement, the following chart should be self explanatory
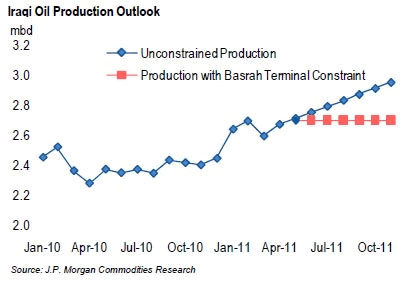
JPM reports June 2011
Reports vary, but there are indications that Saudi Arabia is poised to increase July crude production to 10.0 mbd. This is not confirmed, and it greatly depends on how they offer it to the market, i.e. are buyers willing to take additional crude at OSPs. If the Saudi increase materializes, the market appears better balanced, as we projected a 600 kbd 3Q2011 shortfall at Saudi production of 9.2 mbd. But developments elsewhere leave us cautious.
First, Iraq is critical to incremental supply, adding about 500 kbd over 2011-2012. Production continues to ramp up, but exports recently hit one of the hard constraints we have flagged for some time. The Basrah loading terminal is said to be operating at maximum capacity, with some additional volumes from Khor Al Amaya terminal. This is limiting southern exports to about 1.7 mbd. Relief will come with new single point moorings (SPM), but the first is not likely to come online until late 2011 at the earliest. Some reports show it coming online in mid-2012. Once it comes online exports should surge, but in the meantime our 3Q and 4Q2011 production outlook may need to be scaled back by 120 kbd and 240 kbd, respectively.
Iran is another piece to the puzzle. Iran reportedly drew down floating crude storage by some 12-14 mb in May. Floating storage stood at about 6 mb at the end of May 2011 versus 30 mb in May 2010. Over June-September last year, Iran reduced floating storage by 26-28 mb. This cannot be repeated in summer of 2011.
And some other news flow analysis from JP Morgan:
Several news points of interest from China: (1) China’s M2 money supply growth continued to moderate to 15.1% in May, down from 15.3% in April. New loan creation fell to 552 billion yuan in May compared to 740 billion yuan in April. (2) The NDRC reports that May refinery throughput was up by 4.4% yoy. It calculates implied oil demand rose by 5.2% yoy. (3) Surveys point to a 5% mom reduction in crude throughput in June. This is consistent with an increase in refinery turnarounds to 650 kbd in June and July versus 160 kbd in May.
Analysis:
(1) Chinese policy continues on a path of measured slowing as expected. Our economists expect an uptick in May inflation (announced tomorrow, June 14) to 5.4%. Inflation is expected to peak in June or July. (2) The NDRC data often varies quite widely from the final NBS data. Our May implied demand growth projection stands at 9% yoy, consistent with expected strong crude runs on limited turnarounds. (3) The refinery survey data highlights a dilemma for China. We expect demand to rise by at least 200 kbd qoq in 3Q2011 as refiners are moving into maintenance. The government has taken measures to limit exports to ensure steady supply, but a sharp drawdown in stocks is likely and imports may be required.
Naphtha cracks (versus Dubai crude) continue to retreat. Cracks dropped below -$6/bbl, over $9/bbl down on mid-May highs.
Analysis:
The drivers behind weak naphtha cracks are manifold. As expected, a ramp-up in natural gas liquids production is finally having an impact, as is substitution by LPG. Unplanned cracker outages in Japan and Taiwan are also impacting naphtha demand. The critical driver, however, is the sharp pullback in industrial production (IP) following a period of inventory building in finished goods over 4Q2010 and 1Q2011. Our economists expect some relief in the 3Q2011 as IP is projected to rise by 5.2% yoy following 4.1% growth in 2Q2011. Naphtha should see support end year as IP continues to rise to 5.4% and the seasonal rise in LPG demand begins to price it out as a petrochemical feedstock.
Japanese utilities boosted LNG and oil use in power sharply as nuclear power utilization fell to only 41% in May. Fuel oil consumption increased by 50% yoy and direct crude use was up 126%. Kansai Electric Power is the third power company to warn of shortages and ask consumers to voluntarily cut power consumption.
Analysis:
After a pause in inventory build-up immediately following the Tohoku earthquake, oil consumption in power and purchases are again on the rise. Western Japan is also being impacted as nuclear plants that move into maintenance are facing delayed returns.
But we do not agree with JPM. IRAQ has been progressing well as it has been setting up refinery capacity over the last 18 months and at the same time has been helped by global oil explorators to ink international treaty agreements.
Schlumberger (SLB), Baker Hughes (BHI), Weatherford (WFT), and Halliburton (HAL) have committed to drilling 2,500-3,000 new wells per year and building new pipeline and shipping terminal infrastructure that could make the country the world’s largest oil exporter. The value of these contracts may reach $60 billion (HSBC estimates) over the next six years, and could generate $1 billion in new revenues for each company per year. Iraq is in the process of boosting the country’s oil production from the current 2.5 million barrels a day to 12 million b/d by 2016. Iraq’s oil production peaked at 3 million b/d in 1979, and then went to nearly zero after it invaded Iran.
Things are now changing with Iraq production now coming online. In the latest:
The Iraqi oil ministry held a roadshow in Amman, Jordan, on Sunday for 46 pre-qualified companies interested in bidding for 12 exploration oil and gas blocks.
Iraq expects to add 29 trillion cubic feet of gas and 10 billion barrels of oil to Iraqi reserves from the auction — part of a three-stage plan set by the Oil Ministry to boost proven reserves.
Given the supply coming online from Iraq and the near *infinte* supply from Saudi Arabia, I am at a loss of words to understand on how do we justify a $200 / barrel atleast in the short run. What level of QE is really required to buy buy and hence push the SPY.
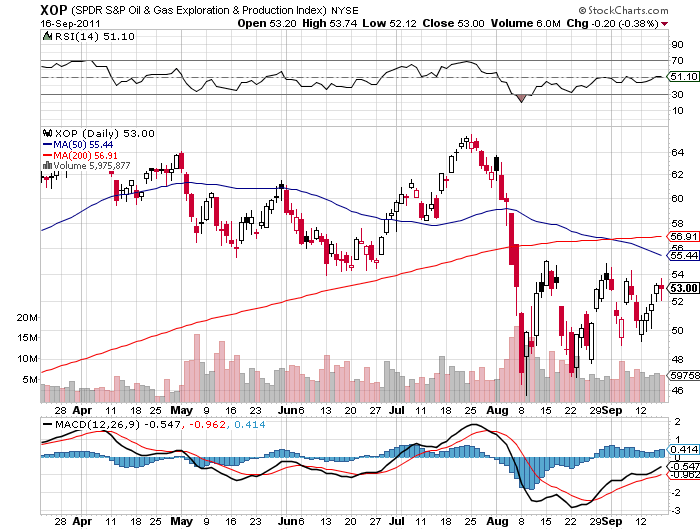
Given the weak fundamentals, we do not then blame the XOP (Exploration and production index) which corrected exactly at the time SPY corrected in August 2011. index struggles under the weight of the death cross as 50dma crossed below the 200 dma.
Unless there can another war in Iraq or a severe constraint in a oil producing country, we are not sure that Oil is a good long term bet (We are not advocating war at all but trying to make a point that Oil fundamentals are at rock bottom). But that should not deter us from looking at companies like Schlumberger (SLB), Baker Hughes (BHI), Weatherford (WFT), and Halliburton (HAL) all of whom are set to gain over $1billion per year in contracts from Iraq.
Coming to CORN and CRB index:
Given the strong dollar surge seen and well predicted in our sept 7,8 and 9 updates to our premium subscribers, we now look at the corollary of dollar index which is the CRB index which measures the performance of the commodities in Jeffrey Index.
CRB Index Daily
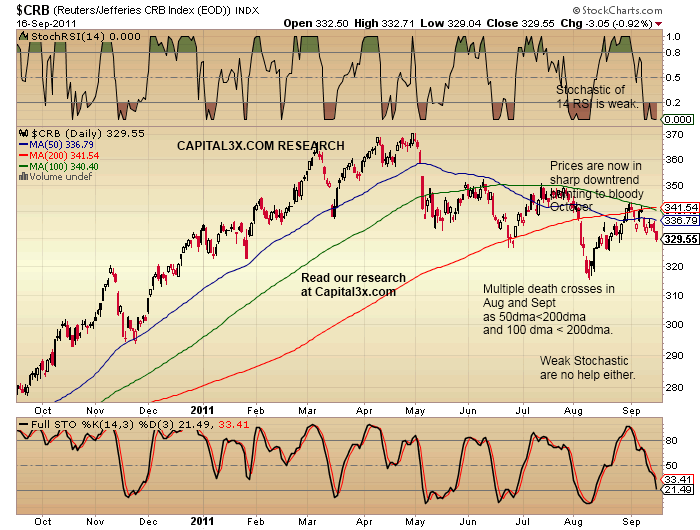
The CRB index has broken its uptrend in May 2011 and since then has been in a measured downtrend. Thhe daily stochastic are well directed for further declines while the Stochastic are also pointing to further declines. The Index has well obeyed the death crosses in August and September. Daily charts are indicating further declines.
Corn Daily Charts
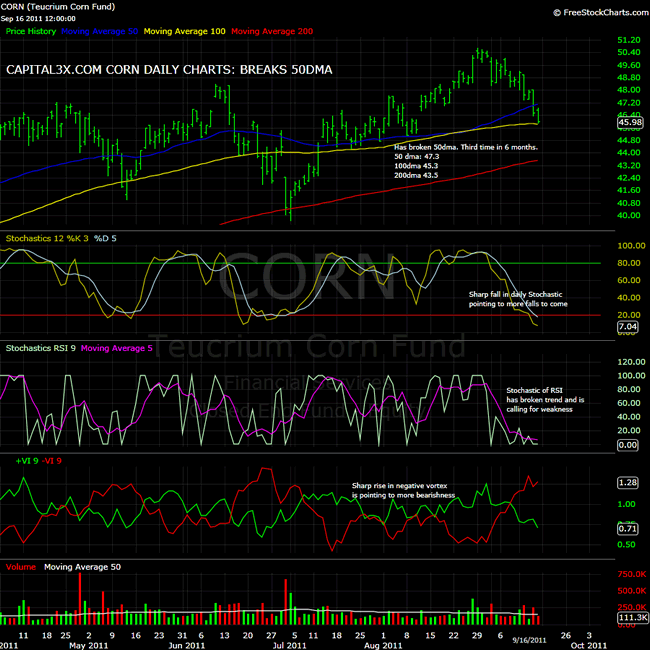
On Corn (CORN ETF), the daily charts show a clear break and close below 50 dma, a key trend line for the charts over the last 6 months. Next up is the 100 dma at 45.3 which looks in grave danger from here. The stochastic are well directed for further declines. The RSI trend has broken down the trend which also now points to further declines. The vortex is beginning to widen the gap opened in August which means further extension of the downtrend.
Corn Weekly Charts
On the weekly charts, more relevant for the long term trader, the 50 wma lies at 42.3 which may start having the magnetic effect on the CORN prices as they attracted to them. Weekly stochastic still point to some long term bullishness but it being contested by the stochastic of the RSI itself which is below 20 advocating weakness.
We continue to watch the price action and will update our premium subscribers with new analysis and charts. Our trade portfolio (Forex, SPX Emini, Crude, Gold, Silver) is visible to our premium subscribers
Our feeds: RSS feed
Our Twitter: Follow Us
Kate
Capital3x.com
Kate, trading experience with PIMCO, now manage capital3x.com. Check performance before you subscribe.
© 2011 Copyright Capital3X - All Rights Reserved
Disclaimer: The above is a matter of opinion provided for general information purposes only and is not intended as investment advice. Information and analysis above are derived from sources and utilising methods believed to be reliable, but we cannot accept responsibility for any losses you may incur as a result of this analysis. Individuals should consult with their personal financial advisors.
© 2005-2022 http://www.MarketOracle.co.uk - The Market Oracle is a FREE Daily Financial Markets Analysis & Forecasting online publication.