


The Gold Continuation Triangle, and the Coming Breakout to $2,100
Commodities / Gold and Silver 2011 Sep 19, 2011 - 03:09 AM GMTBy: Jesse

 The Gold Daily and Silver Weekly charts are growing rather large since the key breakouts that mark this leg of their bull markets. It does give the big picture, but it could make things a little more difficult to see for the short term movements. Here is a closer look at daily gold.
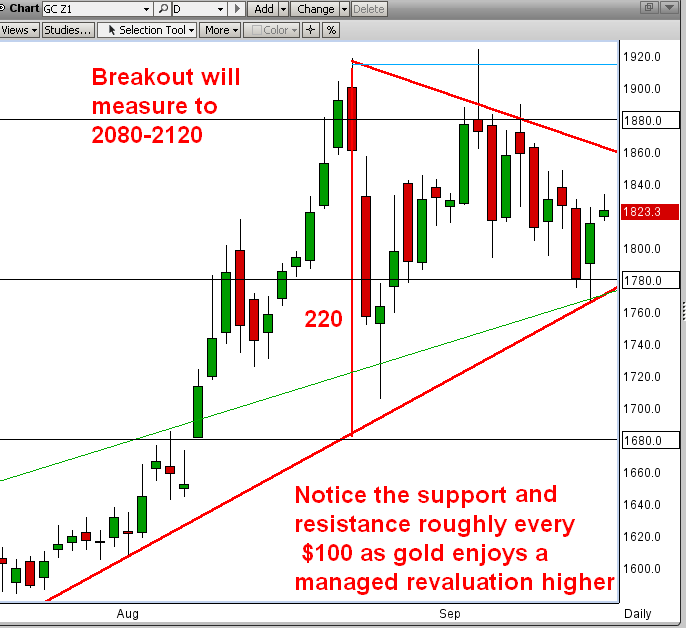
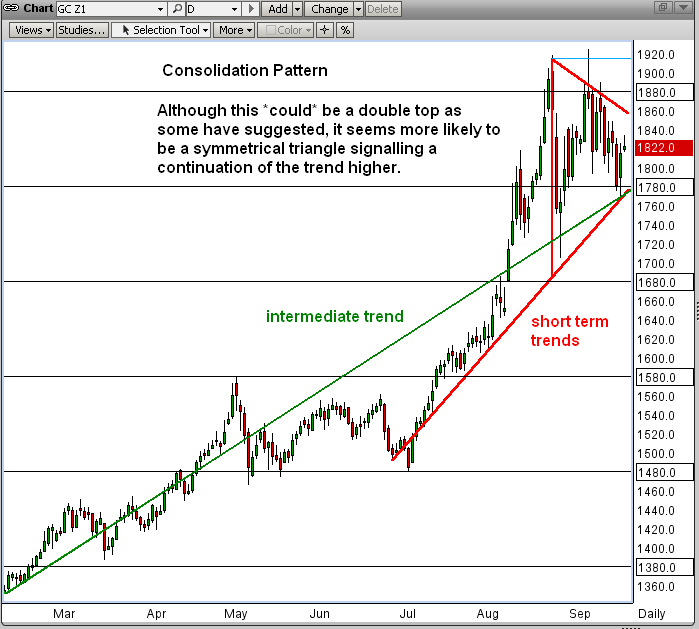
Although there are a number of possibilities, some of which have been promoted by other 'name' chartists which people have sent to me, it seems most likely that gold is in a short term consolidation pattern, as a pronounced symmetrical triangle. A breakout to the upside seems most likely. That breakout will target 2100.
Notice that gold seems to find resistance and support roughly every $100 higher, at the 80's. So we might expect some hesitation and resistance at the 2080 level should the break out occur.
Barring a major intervention by the central banks, or a liquidation selloff, I fully expect gold to continue to move higher. Rumour has it that China has responded with its terms to remain neutral during such an intervention, and they were draconian indeed. And there is no controlling the mass buying by the peoples of Asia which is still just awakening. Buying repression, if any, is most likely in continental Europe if bank runs occur.
Other forms of general political repression which are already underway in the Mideast, are most likely to make their appearances in at least a few Western countries seeking their Orwellian fulfillment. This depends on some variables which are understandably difficult to forecast. Who will be the first Nato member to declare martial law? .
This is not over, not by a long shot. There is no resolution to the global currency and financing situation which is in a multi-decade change from one system to another. So I would say that we are roughly half way there. My long term target for gold has been in the $4000 to $5000 area, although a spike panic could take us as high as $6700. If it reaches that point I will be a seller of at least a portion of my long term holdings.
My longer term target for silver is in the $250 area, although its volatility could take it above $400 in a buying panic or exchange signal failure. I would consider selling long term silver holdings at the $400 level.
All these levels are obviously reviewed as more data becomes available. What else would an intelligent person do?
Watching the intermediate trend on the second chart, the dip towards 1700 was most likely a significant buying opportunity. I hope so as I took it, and in some size, although I have added and subtracted to that position as the trading fluctuations have suggested in this short term pattern.
I own no stocks, and have a slight short position on the SP.
By Jesse
http://jessescrossroadscafe.blogspot.com
Welcome to Jesse's Café Américain - These are personal observations about the economy and the markets. In providing information, we hope this allows you to make your own decisions in an informed manner, even if it is from learning by our mistakes, which are many.
© 2011 Copyright Jesse's Café Américain - All Rights Reserved
Disclaimer: The above is a matter of opinion provided for general information purposes only and is not intended as investment advice. Information and analysis above are derived from sources and utilising methods believed to be reliable, but we cannot accept responsibility for any losses you may incur as a result of this analysis. Individuals should consult with their personal financial advisors.
© 2005-2022 http://www.MarketOracle.co.uk - The Market Oracle is a FREE Daily Financial Markets Analysis & Forecasting online publication.