Stock Market, this is Not 2008
Stock-Markets / Stock Markets 2011 Sep 18, 2011 - 09:30 AM GMTBy: Tony_Caldaro
 It was a wild week for sure. The SPX started the week by declining about 1.5% to 1136 and ended the week hitting 1220 for a 5.4% gain. The Central Banks announced three separate USD swap programs mid-week, to increase liquidity in Europe. There was also lots of talk of an ECB TALF program. In the mean time, in the US, economic reports were decidedly negative. On the plus side: business inventories improved, along with, the current account deficit, consumer sentiment, the Philly FED, and the M-1 multiplier rose. On the negative side: import/export prices declined, along with, retails sales, the CPI/PPI, the NY FED, industrial production, capacity utilization, the monetary base and the WLEI. The budget deficit increased, as did weekly jobless claims. If you are counting that’s five positives and twelve negatives. Nevertheless, the SPX/DOW were +5.05%, and the NDX/NAZ gained 6.45%. Asian markets lost 0.4%, European markets gained 4.2%, the Commodity equity group 0.3%, and the DJ World index gained 2.9%. Next week we have the much awaited FOMC meeting, the yet to be interesting Housing reports, and Leading indicators.
LONG TERM: bear market highly probable
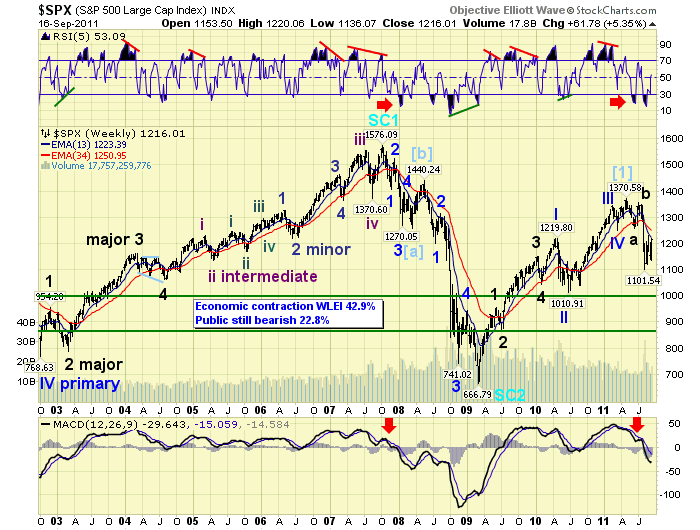
After an important May high in the SPX at 1371, and a July high in the NDX at 2438, the market went into a tailspin. The SPX had lost 19.6%, and the NDX lost 16.5%, by early August. Since then, now mid-September, the SPX has retraced 48% of that decline and the NDX has retraced 68%. New bull market? Not likely. During the 2007-2009 bear market the SPX/NDX declined in fives waves into a Mar08 low. After that they had a two month counter-trend rally that retraced: SPX 57% and the NDX 68% of that decline. We all know what happened next. This bear market is unfolding in a different pattern, thus far.
Instead of fives waves down into a significant low, with market internals extremely oversold. This market has done three waves down into a significant low, with similar internals. This suggests, when this apparent uptrend ends, this market will not collapse like it did in 2008, but will do another set of three waves down to create the bear market low. A couple of weeks ago we worked out some numbers awaiting a potential uptrend confirmation. Since this appears probable, at the moment, this is what we came up with.
The first decline was an ABC which took three months and we labeled it Primary wave A. The current probable uptrend should last until October, two months, and retrace between 50% and 62%, in the general markets, of the first decline: Primary wave A. We will label this uptrend Primary B. Next, we should have three Major waves down to complete Primary wave C and end the bear market. This is likely to take either three or six months, which puts us into January or April. Should the decline be a simple one, three months, we’re looking at a low around SPX 1011, the previous Primary wave II. Should it take six months then the likely target will be the SPX 869 area, the previous Major 2 low of Primary I.
Fibonacci retracement levels of the previous bull market suggest: SPX 1102 (38.2%) which was hit precisely, SPX 1018 (50.0%) and SPX 935 (61.8%). If we take the orthodox low of SPX 1121, for the failed fifth wave, we have a 250 point decline from 1371. Should this uptrend rally to SPX 1261, then we have another three month 250 point decline the SPX would hit exactly 1011. We also have OEW pivots at 1018, 1007 and 988. As a result of all these technical relationships we favor the three month, SPX 1011, bear market bottom scenario.

When we review the weekly chart, we observe the economy is still in contraction mode with the WLEI well below 50%, and the public is quite pessimistic about the economy. Also, the MACD is in bear market territory and still declining. The RSI has worked its way from quite oversold to neutral, and may even hit slightly overbought like it did in July. But until it registers an extremely overbought reading this market will eventually head lower. In conclusion, we’re not as pessimistic as we were at the beginning of the bear market as the wave structure is unfolding like a normal ABC bear market.
MEDIUM TERM: downtrend likely ended at SPX 1102
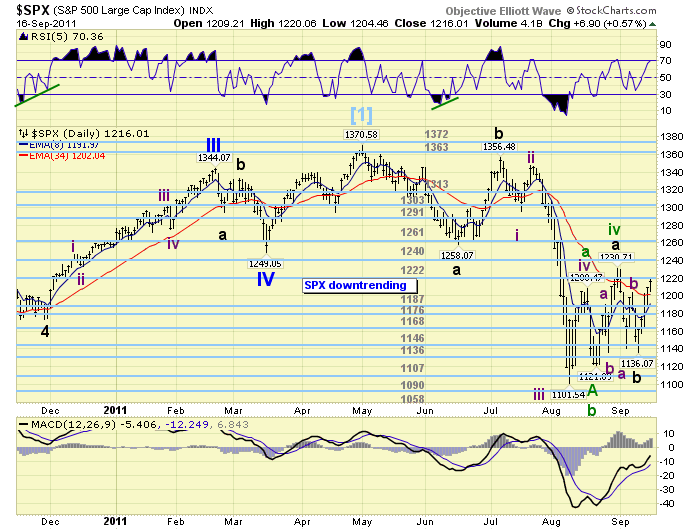
We remain under the assumption, with no OEW confirmation yet, the downtrend from the SPX 1356 July high ended in August, on a failed fifth wave, at SPX 1121. Since then this market has been tracing out an abA-abB-abC counter-trend rally uptrend. Thus far we have observed the abA from SPX 1121 (1191-1136-1231), and the abB from SPX 1231 (1140-1204-1136). Now we should be in the abC portion of this complex double three uptrend.
Thus far we have witnessed a fairly good rally from SPX 1136 to 1220 this friday. This should be the ‘a’ portion of the abC. When it concludes the ‘b’ portion should drop fairly quickly and sharply. The first one, in this structure, dropped 55 points in only one day. Once the ‘b’ portion concludes we should get another good rally to complete the ‘c’ portion, and it will likely coincide with a belated uptrend confirmation. When we review the rising abA we observe three moves: 70 points up, 55 down, and 95 up. The current rally has already gained 84 points, exceeding the ‘a’ of the first similar structure. If we are getting these three waves in reverse this time, it suggests a potential high for ‘a’ at SPX 1231, a decline to 1176, then a rally to 1246. This is all hypothetical of course. But sometimes these structures do unfold this way.

The daily chart suggests the RSI should get quite overbought before this uptrend ends. Thus far it has only touched overbought a couple of times. This suggests the SPX could make it up to the original targets of the 1261 and/or the 1291 pivots. The OEW 1261 pivot fits right in line with our simple bear market scenario ending in January. An uptrend into the 1261 area would also overlap the Jun11 low of SPX 1258. This activity would certainly confirm the current bear market wave count. This market just needs to continue to chop its way higher for about three more weeks for all this to unfold. With two WROC buy signals, since the SPX 1121 low, this scenario appears quite probable.
SHORT TERM
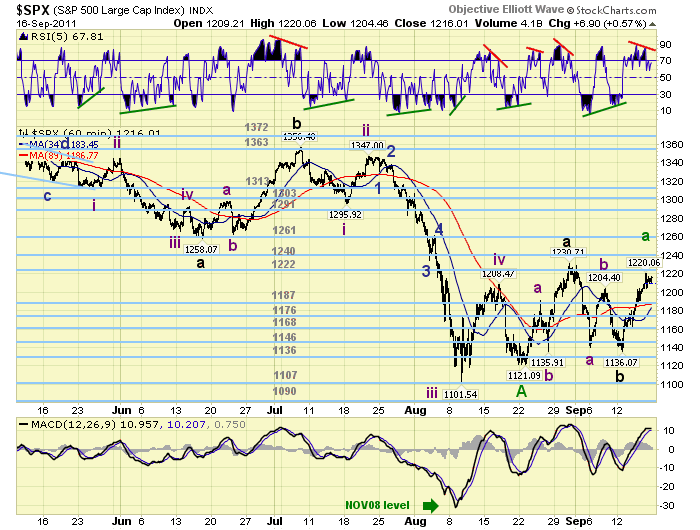
Support for the SPX remains at 1187 and then 1176, with resistance at 1222 and then 1240. Short term momentum just started to decline after registering a negative RSI divergence on the hourly chart. This market has gyrated from one short term divergence to another, with two exceptions, since the market hit SPX 1102 in early August. It has been quite choppy, reacting to the daily news, but well defined and anticipated. A similar bear market counter-trend structure unfolded between Mar08-May08, as previously noted.
We believe this market has set itself up for another disappointing FED statement. Three important lows, during this probable uptrend, have occurred after FED statement/speeches. The SPX 1102 low occurred after the last FOMC statement. The SPX 1136 low occurred after the FED chairman’s speech at Jackson Hole. Then the second SPX 1136 low after the chairman’s speech in Minnesota. We should get another FOMC statement on wednesday. Short term support is in the low 1200′s, then the 1187, 1176 and 1168 pivots. Overhead resistance is in the low 1230′s, then the 1240 and 1261 pivots. Should anything new develop we will naturally update everyone during the week. Best to your trading!
FOREIGN MARKETS
The Asian markets were mixed this week for a net loss of 0.4%. Australia, Hong Kong, and China were all lower.
The European markets we all higher gaining 4.2% on the week.
The Commodity equity group were mostly lower but did have a net gain of 0.3%. Russia and Canada lost ground.
The DJ World index gained 2.9% on the week. Overall individual world markets were quite mixed.
COMMODITIES
Bonds lost 1.0% on the week as negatvie divergences continued to appear on the daily charts. The 10YR yield moved over 2% to 2.08% after touching a record low at 1.90%.
Crude continued its choppy upside activity, which is looking more and more like a rising wedge, gaining 1.0% on the week.
Gold still appears to be in an unconfirmed downtrend and lost 2.4% on the week. Every time Gold declines it seem to find buyers waiting in the wings. Silver, -1.9%, appears to be just following along at the moment.
The USD lost some ground this week (-0.8%) but remains in an uptrend. Benefitting from the USD swap programs the downtrending EUR gained 1.1%, and the JPY gained 1.3%.
NEXT WEEK
The economic calendar kicks off on monday, of this FED week, with the NAHB housing index at 10:00. Tuesday we have Housing starts and Building permits. Then on wednesday Existing home sales and the FOMC statement around 2:15. On thursday, weekly Jobless claims, the FHFA housing index and Leading indicators. The FED has nothing else scheduled. Best to you and yours this weekend and week.
CHARTS: http://stockcharts.com/...
http://caldaroew.spaces.live.com
After about 40 years of investing in the markets one learns that the markets are constantly changing, not only in price, but in what drives the markets. In the 1960s, the Nifty Fifty were the leaders of the stock market. In the 1970s, stock selection using Technical Analysis was important, as the market stayed with a trading range for the entire decade. In the 1980s, the market finally broke out of it doldrums, as the DOW broke through 1100 in 1982, and launched the greatest bull market on record.
Sharing is an important aspect of a life. Over 100 people have joined our group, from all walks of life, covering twenty three countries across the globe. It's been the most fun I have ever had in the market. Sharing uncommon knowledge, with investors. In hope of aiding them in finding their financial independence.
Copyright © 2011 Tony Caldaro - All Rights Reserved Disclaimer: The above is a matter of opinion provided for general information purposes only and is not intended as investment advice. Information and analysis above are derived from sources and utilising methods believed to be reliable, but we cannot accept responsibility for any losses you may incur as a result of this analysis. Individuals should consult with their personal financial advisors.
© 2005-2022 http://www.MarketOracle.co.uk - The Market Oracle is a FREE Daily Financial Markets Analysis & Forecasting online publication.


