


Gold heading to $2,350 after EWT Wave 4 Consolidation
Commodities / Gold and Silver 2011 Sep 14, 2011 - 10:11 AM GMTBy: David_Banister

 In my most recent few forecasts for subscribers and public articles I’ve discussed a major correction in Gold, and it dropped $208 within 3 days of that forecast several weeks ago as Gold traders will recall. Last week I wrote about further consolidation being required in what I’m seeing as a either 4th wave likely “Triangle Pattern” that will consolidate the 34 month run from $681 to $1910 into August of this year, or a 3 wave “A B C” pattern. We are right now in some form of C wave, it’s just a matter now of confirming if we are going to get a “D and E” wave to follow, or the C wave drops lower before we bottom.
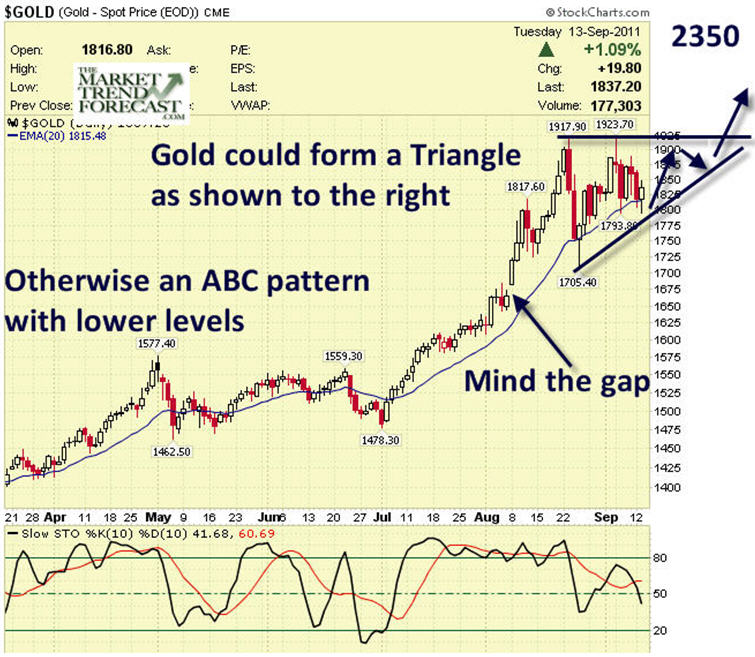
A Triangle pattern serves to let the “economics of the security” catch up with the prior large movement upwards in price. In essence, the crowd behavior pushed the price of Gold a bit too high too fast, and this consolidation pattern lets the fundamentals catch up to price action. We had a parabolic move I discussed many weeks ago, and those always end badly to the downside. The $208 drop in three days is a typical reaction to a spike run like that. At the end of the day though, I had been forecasting what I call a “Wave 3” top and was looking for a multi week or multi month consolidation pattern before Gold could move higher.
Let’s examine what that triangle projection may look like. They take the form of 5 waves, or what we can call ABCDE in a pattern. The biggest drop is always the “A” wave, and that was 1910 to 1702 in 3 days or less. The next biggest drop is the “C” Wave, and that was 1920 to 1793, noting it was a Fibonacci 61.8% drop relative to the A wave. In other words, each successive wave down in the 5 wave triangle is smaller. This is due to the sentiment finally shifting and the trading patterns moving from people chasing the hot sector or stock or metal, to the long term investors accumulating the dips.
If we end up consolidating in a “Triangle”, then Gold should end up looking something like the below pattern I drew, with a target of $2,350 per ounce many months out:
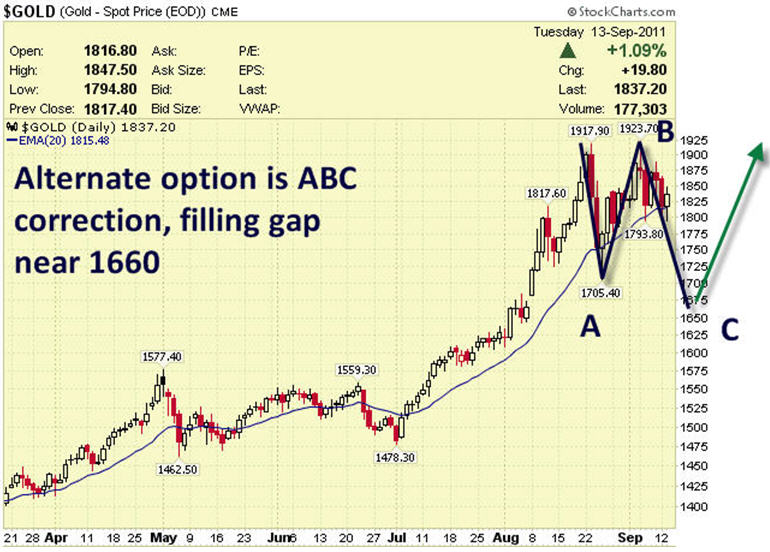
The other pattern we are watching for at TMTF is the ABC Correction pattern. We had the A wave down to 1702, which corrected 50% of the move from 1480-1910 in 3 days. Rarely do you get a major move down like that and not get some type of “re-test” of that low, but because the fundamentals for Gold are strong and getting stronger, we are favoring the Triangle pattern still as most likely. With that said, there is a fat and juicy “Gap” sitting in the chart around 1660 on Gold and dropping down there is what a lot of traders are watching. If that were to fulfill, then we will see an ABC correction ending around $1643, and then Gold will begin another multi month rally to new highs:
At TheMarketTrendForecast.com I teach people my crowd behavioral methodologies and give them reliable forecasts in advance so they can be prepared with their investments. Consider working with us and following the SP 500, Silver, and Gold by going to www.MarketTrendForecast.com You can take advantage of a 33% discount over the next 48 hours as well.
Dave Banister
CIO-Founder
Active Trading Partners, LLC
www.ActiveTradingPartners.com
TheMarketTrendForecast.com
Dave Banister is the Chief Investment Strategist and commentator for ActiveTradingPartners.com. David has written numerous market forecast articles on various sites (SafeHaven.Com, 321Gold.com, Gold-Eagle.com, TheStreet.Com etc. ) that have proven to be extremely accurate at major junctures.
© 2011 Copyright Dave Banister- All Rights Reserved
Disclaimer: The above is a matter of opinion provided for general information purposes only and is not intended as investment advice. Information and analysis above are derived from sources and utilising methods believed to be reliable, but we cannot accept responsibility for any losses you may incur as a result of this analysis. Individuals should consult with their personal financial advisors.
© 2005-2022 http://www.MarketOracle.co.uk - The Market Oracle is a FREE Daily Financial Markets Analysis & Forecasting online publication.