


Dangerous Stock Market VIX Circle Pattern
Stock-Markets / Volatility Sep 14, 2011 - 08:20 AM GMTBy: Marty_Chenard

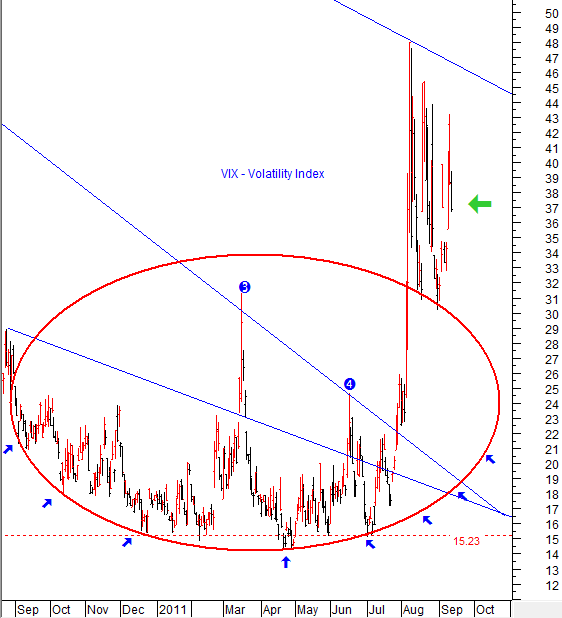
Every couple of years, this "Circular VIX Pattern" has been showing up. It is a pattern where you can draw a circle off the VIX lows, and once you move to the half way point past the middle of the circle ... the support starts to move up which means the market moves down.
We posted this pattern for readers in July but some readers never heard of such a thing so they ignored it. But, for those who didn't, it sent ample warnings to become more and more cautious as the market became more and more dangerous.
Take a quick look at today's updated chart and you will see what we mean. The way the pattern has played out has been an obvious clue for VIX followers that the market was in trouble. Note the behavior of this pattern since August ... Note that the VIX has shot up above the top of the circle and the top part of the circle has become support. The VIX has tested that support twice now (as seen on the chart), and each time it could not penetrate it so it closed above the circle on each of those two attempt days.
The VIX has made lower/tops and lower/lows since August, so it has been slowly losing it "high fear" intensity. Although that high fear level has been diminishing, but it has not broken down yet. The current pattern is very large, so a large directional move should happen soon.
Is it a guaranteed down direction on the VIX?
No, not yet... because large Institutional Investors are still hedging and worried about European conditions and possible defaults.
However, a downside bias is trying to build on the VIX, and unless we get a negative "event" surprise, expect the VIX to continue down to test the top of the circle's support fairly soon. That downward VIX movement would correlate with upside market movement ... since the VIX moves opposite to the market's direction.
Even with the VIX moving lower to re-test the circle's support, the market will remain in a high risk, volatile condition until the VIX falls below a level of 26. Why 26? Because some Institutional selling programs are still engaged to fire off quickly until the fix falls below a level of 26.
By Marty Chenard
http://www.stocktiming.com/
Please Note: We do not issue Buy or Sell timing recommendations on these Free daily update pages . I hope you understand, that in fairness, our Buy/Sell recommendations and advanced market Models are only available to our paid subscribers on a password required basis. Membership information
Marty Chenard is the Author and Teacher of two Seminar Courses on "Advanced Technical Analysis Investing", Mr. Chenard has been investing for over 30 years. In 2001 when the NASDAQ dropped 24.5%, his personal investment performance for the year was a gain of 57.428%. He is an Advanced Stock Market Technical Analyst that has developed his own proprietary analytical tools. As a result, he was out of the market two weeks before the 1987 Crash in the most recent Bear Market he faxed his Members in March 2000 telling them all to SELL. He is an advanced technical analyst and not an investment advisor, nor a securities broker.
Marty Chenard Archive |
© 2005-2022 http://www.MarketOracle.co.uk - The Market Oracle is a FREE Daily Financial Markets Analysis & Forecasting online publication.