


The Chart That Predicted '87 Stock Market Crash Now Predicts Major Rally
Stock-Markets / Stock Markets 2011 Sep 12, 2011 - 10:24 AM GMTBy: Sara_Nunnally

 I just got my hands on something juicy...
We've been talking about technical analysis and being able to read charts here at Smart Investing Daily for the past couple of weeks.
One of the easiest ways of looking at a chart is to identify a trend. Is the stock rising?
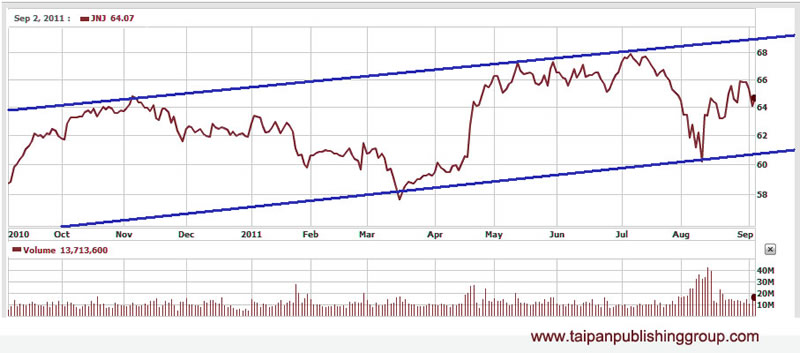
Or is the stock falling?

The next easiest way of looking at charts is through cyclical movements.
For example, people use more natural gas in the winter and summer to heat and cool their homes. We should see prices follow that cycle of demand.
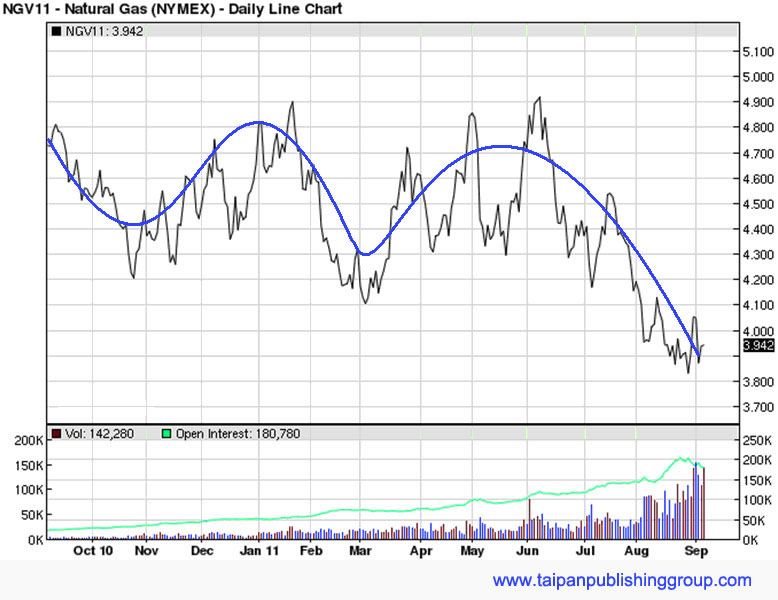
You can see prices rise in winter and summer, and dip in spring and fall.
One thing that cyclical charts have in common is yearly correlation. What I mean is that this pattern is repeated year after year.
Here's where things get juicy.
Predicting the Markets through Technical Analysis
You may have heard of a man named Paul Tudor Jones. He's the guy who predicted the stock market crash of 1987. He did it armed only with one chart.
In fact, this chart was so successful in predicting the crash that PBS made a documentary showing the technique that made Jones a millionaire. It's called TRADER: The Documentary... and there aren't that many copies in existence anymore. Jones realized he gave his charting secret away, and asked that the film be destroyed.
But his technique is still out there, and our own Andy Snyder is now predicting a major market rally by the end of the year using this same analysis.
With all the doom and gloom -- high unemployment, sour housing market, low consumer confidence -- you have every right to be skeptical. In fact, I encourage you to be. If anything good has come out of all this bad news and even worse economic policy, it's forced investors to question everything that comes out of Wall Street's and the government's mouth.
But it's hard to argue with what a chart says.
Andy, who writes for our Insider newsletter (which you have access to if you subscribe to one of our services), slipped me a note last week asking me to share his latest research with you. Here's what he told his readers:
We are in the midst of a very profitable opportunity. To help prove it, I want to show you something we published on Aug. 23.
It is part of a letter I sent to subscibers who will join us at our annual enclave in Las Vegas in a few weeks.
I hope you already read it:
Times are tough. Stocks are falling. Risk is rising. And the future is more uncertain than ever. But I have something you will like. I recently did some research and I realized things may not be all that bad. The pain we are experiencing right now may soon lead to a meteoric rise in stock prices. In fact, using a little historical perspective, from now through the end of the year may be one of the most lucrative periods in more than a decade.
When I wrote that, the S&P 500 was at 1,123 -- just 4 points above its lowest closing point for the year.
In the days since, the market has gone up... and up... and up.
The S&P 500 closed yesterday up 2.86%. It's now putting in higher lows and establishing a new uptrend. This is the index over the past month...
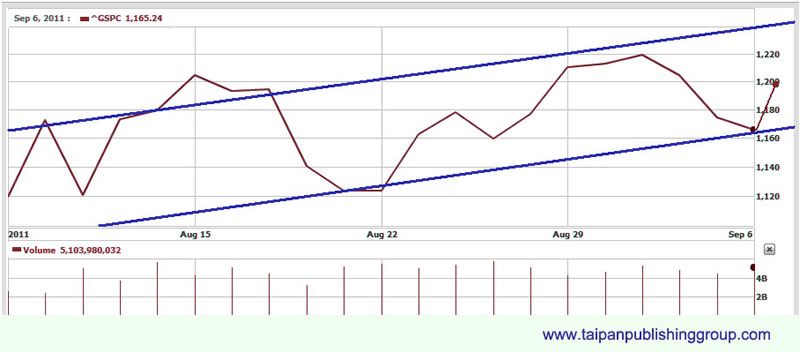
I've added Wednesday's price movement to the chart. Remember, Andy told his readers that the S&P 500 was in for a rally on Aug. 23, just as the index was bouncing off its low.
That's great timing... And Wednesday's run helped establish the uptrend in the chart.
But this little nip higher could be just the beginning of a monster rally. Andy has published a video showing you the spot-on charting technique pioneered by Paul Tudor Jones. It clearly shows the market could boom, and that now is the best time to get positioned.
This chart has shown some serious accuracy over the past year... It's something you definitely need to see. Access this video here, and get prepared.
Publisher's Note: These simple charts are just the beginning of in-depth analysis. In fact, Jared, our hottest new analyst, has six computer screens on his desk to help him find the next investment opportunity. And he's been hitting bull's eye after bull's eye.
Now barely four months on the job and he's cemented his reputation as the "Money DOUBLER." And he wants to share his techniques with you.
Don't forget to follow us on Facebook and Twitter for the latest in financial market news, investment commentary and exclusive special promotions.
Source : http://www.taipanpublishinggroup.com/tpg/smart-investing-daily/smart-investing-090811.html
By Sara Nunnally
http://www.taipanpublishinggroup.com/
Sara is Managing Editor of Smart Investing Daily. As Senior Research Director and global correspondent, Sara Nunnally's diverse resume includes studies in art history, computer science and financial research. She has appeared on news media such as Forbes on Fox, Fox News Live, and CNBC's Squawk Box, as well as numerous radio shows around the country. Most recently, Sara co-authored a book with Sandy Franks called, Barbarians of Wealth.
Copyright © 2011, Taipan Publishing Group
© 2005-2022 http://www.MarketOracle.co.uk - The Market Oracle is a FREE Daily Financial Markets Analysis & Forecasting online publication.