Gold Parabolic, BGMI, HUI and Small Miners with Big Earnings
Commodities / Gold & Silver Stocks Sep 12, 2011 - 08:22 AM GMTBy: John_Townsend
 I've spent the past couple of weeks learning a new skill - making charts using Microsoft Excel. This article will use my new skills to compare gold's current C-wave development with gold's great parabola that concluded on January 21, 1980, as well as examine the historic relationship of gold with gold mining stocks using both the BGMI (Barron's Gold Mining Index) and HUI (Amex Gold Bugs Index). Then we will conclude with some charts of miners that appear to have not only explosive future earnings, but also explosive future price appreciation.
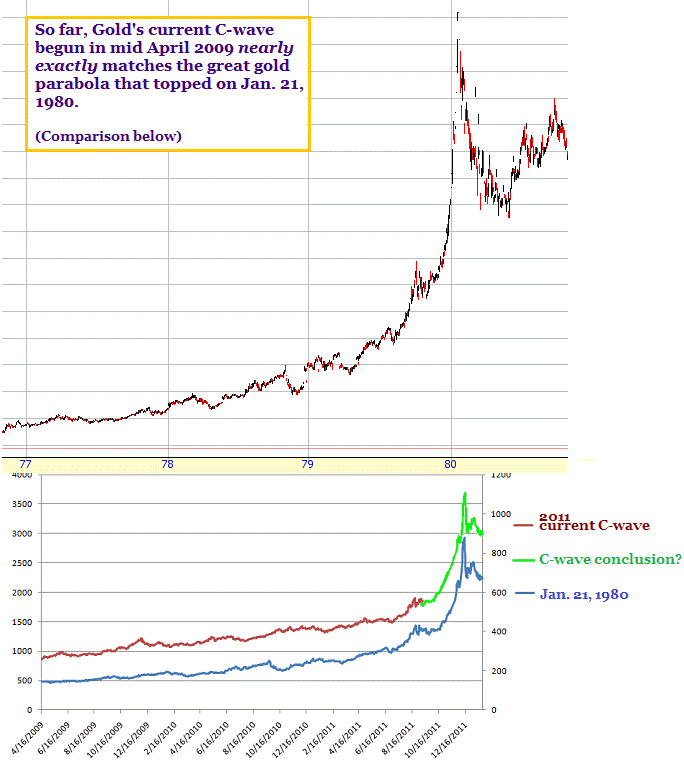
The upper portion of this chart is the great 1977-1980 gold parabola that blew up on January 21, 1980.
The lower portion of the chart uses the Excel spreadsheet to recreate this parabola (in blue). The red line is the price of gold from the beginning of the current C-wave (April 16, 2009). The green line is essentially a duplication of the conclusion of the great 1980 parabola 'glued' onto the current gold price.
I am showing you this in the context of historical perspective and not in the context of price prediction.
Honestly, I shudder to think what it what take for gold to now double it's current price of $1857 to over $3700 in the next 10 weeks. But I do recognize that it is possible - particularly because, as we observed in 1980, it has happened before.
I can indeed think of several realistic mechanisms to make this happen as 'historically contemplated' on this chart (think Bernanke and QE 3, Europe and sovereign defaults, Comex futures short squeeze of exciting proportion, and other possibilities including war and so on).
The mining indices we are familiar with, such as the HUI (Amex Gold Bugs Index) and XAU (Philadelphia Gold/Silver Sector Index), believe it or not, have not existed for all that long. The HUI dates back to mid-1997 and the XAU only to mid-1995.
Fortunately, there is an index of precious metal mining stocks that predates both the HUI and XAU - and it is the BGMI (Barron's Gold Miners Index). Data and charting of this historical index is available online (BGMI link HERE) and dates back to 1939.
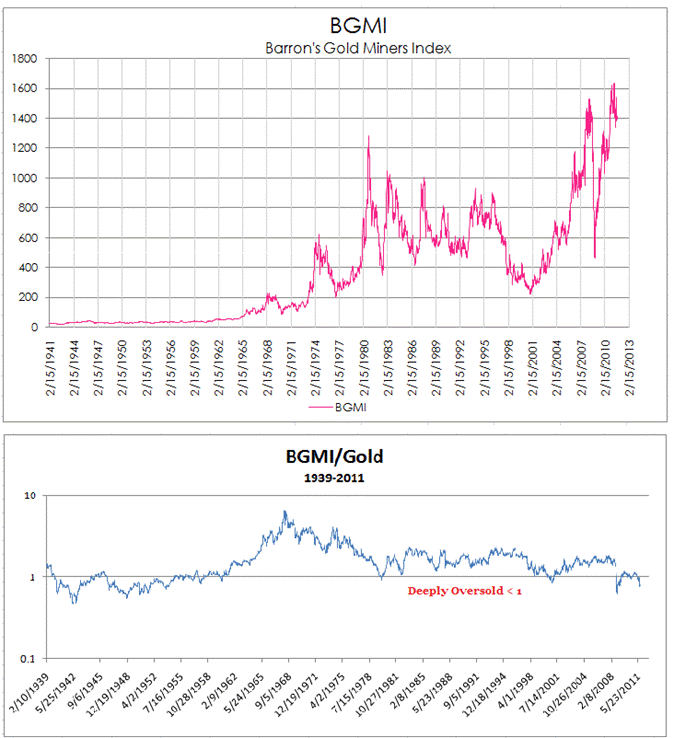
This next chart shows you both the BGMI price action to the present day, as well as a log-scaled chart that suggests the relationship between this index of gold miners to the ever changing price of gold.
The lower portion of the chart suggests that a BGMI/Gold ratio at or below 1:1 has been consistent with the beginning of huge gold miner stock rallies, particularly since 1978. Unfortunately, I did not design both of these charts ('glued' one atop the other) with the identical time frame - which means that 1.0 readings on the lower chart do not line up precisely with the rally origins in the upper chart.
But hey, I warned you I am just learning how to do this stuff.
At any rate, using this metric it appears the gold miners are seriously oversold and likely to rally hard. The current reading is well below 1:1.
If you would like to study the BGMI in greater detail, Mark Lundeen has authored a number of outstanding analyses which include: 1, 2 and 3.
Let's turn now to the HUI index and see if it too is suggesting a bullish future for the miners.
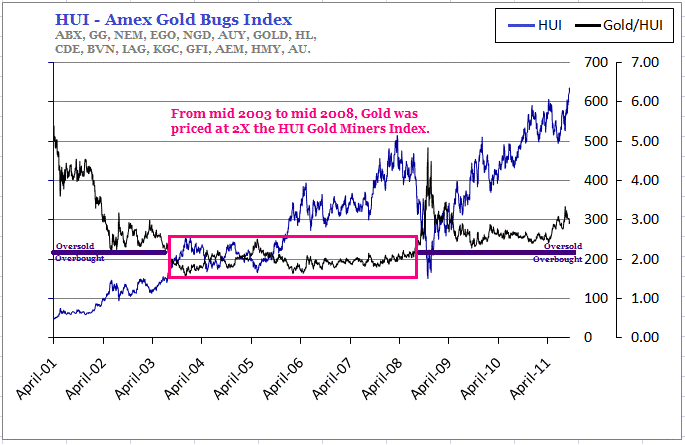
The HUI index consists of 16 miners that are not equally weighted within the index. I have noted these miner's ticker symbols in the upper left corner of the chart.
The immediately striking observation one makes is that gold tends to be priced at 2 times that of this index. (ie. if gold is $1000, the HUI would be close to $500).
Then we notice that at the beginning of gold's secular bull market in 2001, the miners were way out of whack - with gold comparatively selling at a 4-5X premium to the gold bugs index. This led to a miners rally that nearly tripled their value in less than 16 months.
The HUI miners bottomed ahead of gold, reaching a closing price of just $35.99 on November 14, 2000. As of this date September 11, 2011, the HUI index has gained 17 times it's value in November, 2000 ($628.34 vs. $35.99).
By the way, gold bottomed on April 5, 2001, 5 months following the miner's low, with a closing price of $255.45. As of this past week, gold has appreciated over 7 times it's value since making it's secular market low in April 2001 ($1857 vs. $255).
The other thing we notice about this chart is that since 2008 the mining index has not been able to get back to it's more 'balanced' 2X relationship with gold. At present gold is selling for about 3 times the price of the index. Will the HUI index now rally more fervently than gold to close this oversold difference? I don't know.
I can observe that while miners rallied strongly higher during the final 3 months of gold's 1980 parabola (gaining 50+%), they were no match for the rocket launch of the precious metal itself, as gold literally more than doubled in this time period. However, once gold and the miners peaked and then spent 3 months working off a severely overbought status with a sharp 25-35% correction, the miners proceeded to literally double in the following 6 months as gold made a failed attempt to reach the parabolic high.
Finally, let's take a look at the daily/weekly charts of three miners with big earnings.
I am particularly indebted to the outstanding resource produced by Bill Matlack of Scarsdale Equities and published this past Friday at www.Kitco.com
I studied about 200 miner charts to select these three to show you. There are more than three that interest me, of course, but I will need to get to them another time.
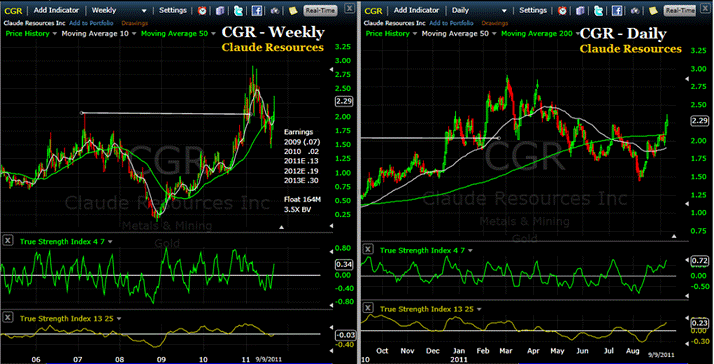
This is Claude Resources Inc. (CGR). The earnings data, past and estimated is noted on the weekly chart. The right side of the chart is the daily view of CGR.
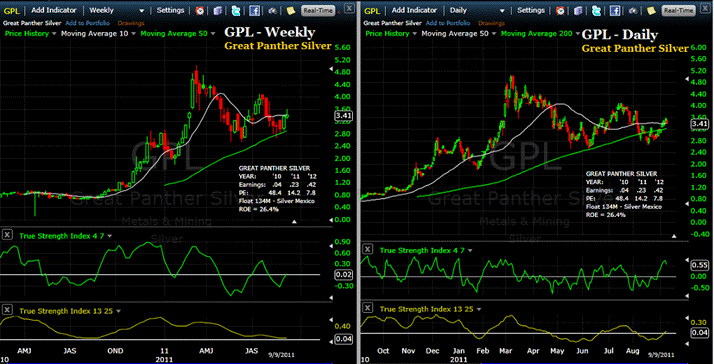
Next up is Great Panther Silver (GPL). The earnings data is on the weekly side of the chart as well as the daily side.
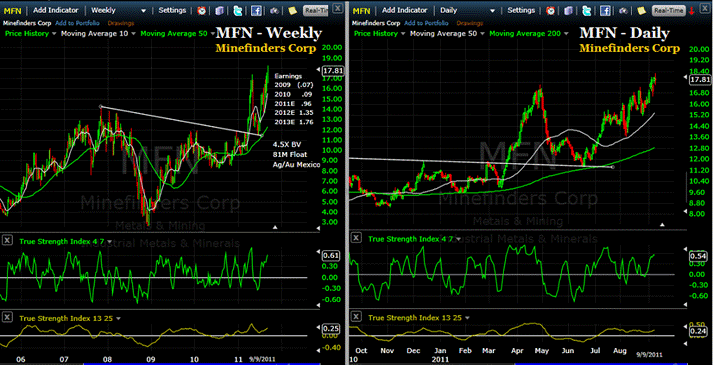
And finally my personal favorite which is Minefinders Corp (MFN). The float is small at 84Million shares, gold and silver mines producing in 'safe' Mexico, and the projected earnings are simply breathtaking. Any stock that can go from .09 per share to $1.76 in just three years deserves a good hard look. (!)
And which of these stocks do I own?
Not one. But that may change this week.
Good trading to you.
John Townsend mailto:TSItrader@gmail.com
© 2011 Copyright John Townsend - All Rights Reserved
Disclaimer: The above is a matter of opinion provided for general information purposes only and is not intended as investment advice. Information and analysis above are derived from sources and utilising methods believed to be reliable, but we cannot accept responsibility for any losses you may incur as a result of this analysis. Individuals should consult with their personal financial advisors.
© 2005-2022 http://www.MarketOracle.co.uk - The Market Oracle is a FREE Daily Financial Markets Analysis & Forecasting online publication.


