Fed 'Twisting' Will Stimulate Economic Activity for Bond Market Traders
Interest-Rates / US Bonds Sep 10, 2011 - 12:22 PM GMTBy: Paul_L_Kasriel
 The consensus view is that after adjourning from its September 20-21 meeting the FOMC will announce a plan to lengthen the maturity structure of its securities portfolio by increasing the proportion of longer-maturity securities in the portfolio. Importantly, the size of the overall securities portfolio is likely to be held constant. Thus, shorter-maturity securities will be sold and/or allowed to run-off and be replaced with a like dollar amount of longer-maturity securities. Presumably, the intended purpose of these securities transactions is to push down yields on longer-maturity securities. The FOMC most likely would prefer that the yields on shorter-term securities remain at their current very low level, but would not be terribly disturbed if these yields drifted up a bit as more of these shorter-maturity securities were dumped into the market from the Fed's portfolio. The presumed purpose of this "twisting" of the shape of the yield curve is to stimulate the demand for longer-lived real assets such as houses, durable consumer goods, business capital equipment and nonresidential real estate by lowering the interest rates on longer-term fixed rate loans and securities.
There seems to be a presumption among most economists, but not us, that the bulk of economic agents' spending decisions are made on the basis of the yield on long-term interest rates. As far as we know, there is no requirement that the purchaser of a house must finance it with a 30-year fixed-rate mortgage. There are adjustable-rate mortgage products available that are priced off of the yields on short-term securities. We have always wondered why central banks target the levels of short-term interest rates if it is the levels of long-term interest rates that economists believe affect the pace of economic activity. But again, who are we to question the best and the brightest?
If you think that the "science" of what causes global warming is unsettled, you ought to delve into the "science" of what determines the shape of the yield curve. One theory hypothesizes that expectations of the future levels of short-term interest rates determine the current levels of longer-term interest rates. So, if investors currently believe that in the future short-term interest rates will be rising, then the current levels of longer-term interest rates will rise. What's the mechanism that causes this? If both lenders and borrowers currently expect that the levels of future short-term interest rates will be rising, then borrowers currently will decrease their demand for shorter-term financing, not wanting to be rolling over this financing in an expected rising short-term interest rate environment. Rather, borrowers currently will increase their demand for longer-term financing in order to lock-in the current longer-term borrowing rates. Lenders currently will increase their demand for shorter-term securities so as to be rolling over their principal at higher expected short-term interest rates. Thus, lenders will be selling their longer-term securities and replacing them with shorter-term securities. So, when there is a change in expectations such that shorter-term interest rates are expected to rise more than previously thought, there will be a decrease in the demand for shorter-maturity credit accompanied by an increase in the supply of shorter-maturity credit. This would tend to push down the yield on shorter-maturity credit. At the same time, there will be an increase in the demand for longer-maturity credit accompanied by decrease in the supply of longer-maturity credit. This would tend to push up the yield on longer-maturity credit.
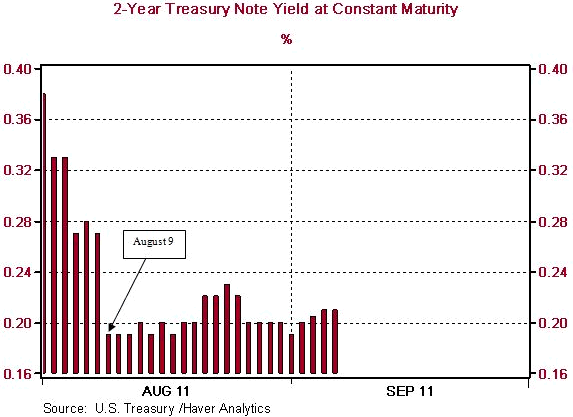
If you buy this, then the next big question is what determines expectations about the behavior of future short-maturity interest rates. As we mentioned earlier, central banks traditionally have targeted the levels of short-term interest rates. Within tolerances close enough for government work, central banks can hit their targets because they control the supply of fiat credit. So, it is expectations about the future levels of central bank short-maturity target rates that play a large role in affecting borrowers'/lenders' expectations of the levels of future short-term interest rates. To see this in action, observe what happened to the yields on the Treasury 2-year securities between August 8 and August 9 of this year. On August 9, the FOMC announced its decision to plan to keep the level of the overnight cost of unsecured funds, the federal funds rate, in a range of zero percent to 0.25 percent through at least mid 2013 - approximately two years into the future. On August 8, the yield on the Treasury 2-year security closed at a level of 0.27%. If both borrowers and investors believed that the Fed would, in fact do this, lenders would want to immediately lock-in a fixed two-year yield above 0.25% and borrowers would want to switch their financing from a fixed two-year rate above 0.25% into something shorter-term. Chart 1 shows that on August 9, after the FOMC made its announcement, the yield on the Treasury 2-year security closed at 0.19%, down from 0.27% on August 8. This was the expectations theory of the shape of the yield curve in action. Two years, of course, is not ten years. But the FOMC's August 9 "pledge" that it would keep the federal funds rate in its current range for two years was not what was expected on August 8. The expectation was that the fed funds rate would be rising before midyear 2013. So, this change in expectations also had the effect of lowering the yield level on the Treasury 10-year security by 20 basis points between the close on August 8 and the close on August 9 because there had been a change in expectations about the future behavior of the level of short-term interest rates. This is exactly what the FOMC's August 9 announcement was designed to do - push down the yields on longer-term securities. Why? Remember, the received wisdom is that it is the behavior of longer-term interest rates that affects the behavior of demand for goods and services in the economy.

But wait, there's more - more theories of what determines the shape of the yield curve. The other major competing theory of the determination of the shape of the yield curve is the preferred-habitat theory. This theory hypothesizes that borrowers and lenders are not indifferent as to what maturities they borrow and lend in. For example, pension funds, which have relatively long-lived liabilities, have a preference for longer-maturity assets. Businesses financing inventories would have a preference for shorter-term liabilities. According to the preferred-habitat market hypothesis, then, changes in the relative supplies of securities of different maturities can have an impact on the shape of the yield curve. So, if the Fed dumps more shorter-maturity securities on the market and increases its demand for more longer-maturity securities, then, all else the same (the economist's favorite hedge because all else seldom is the same), the yields on shorter-maturity securities ought to move up whilst the yields on longer-maturity securities ought to move down.
So, the FOMC is not taking any chances on which theory of the shape of the yield curve is correct. If the FOMC's goal is to lower the yield levels of longer-maturity securities, then announcing that it will hold short-term yields lower and longer than previously expected and purchasing more longer-maturity securities both would work in this direction. As an aside, lengthening the maturity of its portfolio whilst keeping the dollar value of it constant would not tend to increase the yield level much on shorter-maturity securities, say the yield on a Treasury 2-year security, if, at the same time the FOMC announces that it will keep its federal funds rate target near zero for at least the next two years.
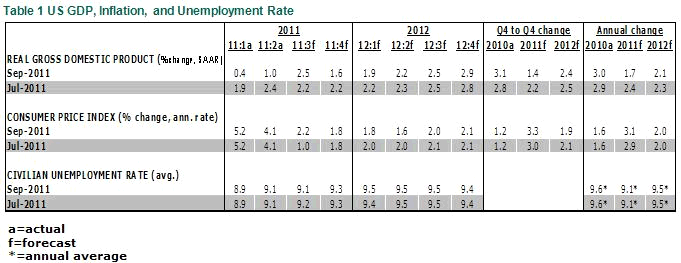
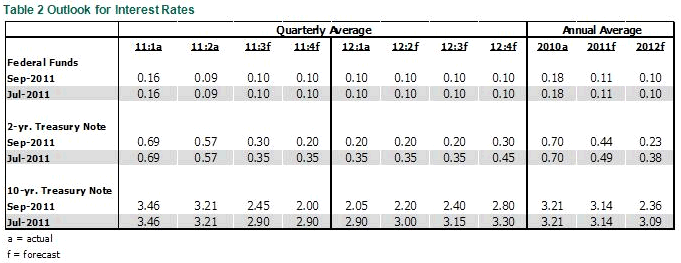
All well and good. The FOMC is determined to lower the yield levels on longer-term interest rates and it has. As we said, on August 8, the yield on the Treasury 10-year security closed at 2.40%. On September 8, this yield closed at 2.00%. Of course, the yield on the 10-year Treasury security already had been trending lower right after the FOMC terminated its purchases of Treasury coupon securities on June 30 - purchases that led to outright increases in the size of the Fed's securities portfolio. According to the preferred-habitat theory of the shape of the yield curve, the FOMC's termination of coupon securities purchases should have resulted in an increase in the yield levels. But once again, a beautiful theory was spoiled by some ugly facts. On July 1, the yield on the Treasury 10-year security closed at 3.22%, on its way down to 2.40% on August 8, the day before the FOMC took the pledge to keep the federal funds rate near zero at least until midyear 2013. Was this decline in the Treasury 10-year yield a sign of increased Federal Reserve monetary policy accommodation? We cannot recall any public pronouncements by Federal Reserve officials along these lines. Just the opposite. From Dallas Fed President Fisher and Philadelphia Fed President Plosser, the Federal Reserve "Wrong-Way Corrigans," we heard that, if anything, less monetary policy accommodation was called for. No, the decline in the Treasury 10-year yield and the declines in the prices of industrial commodity prices were symptoms of another change in expectations - a change in the expectations of the behavior of the U.S. economy in the second half of this year. You see, the consensus expectation was that the pace of economic activity was going to be shifting into a higher gear in the second half of 2011. The July Blue Chip consensus estimate for U.S. second-half annualized real GDP growth was 3.2% (Ours was 2.2%.) The September consensus second-half forecast is now 1.8%! (Ours is a smidge above 2%, the first time in a long time we have been above the consensus.)
Suppose that the economy remains in a funk, asset prices continue to fall and the prices of goods and services begin to fall. There could be another revision to expectations about how long the FOMC will keep the federal funds rate near the zero level. The market may come to expect that the Fed will not begin raising the federal funds rate until midyear 2014. If this expectation were to take hold, then, according to the expectations theory of the shape of the yield curve, the levels of yields of longer-maturity securities would fall further. In this example, should the further decline in bond yields be interpreted as a more accommodative monetary policy? We would view the decline in bond yields under these circumstances as an indication of too-restrictive a current monetary policy. But that's just us.
We continue to believe that what ails this economy the most right now is weak domestic demand for goods and services. And we continue to believe that a major factor holding back stronger domestic demand is weak growth in depository institution credit - the credit created by primarily commercial banks, but additionally S&Ls and credit unions. We believe that this weak growth in depository institution credit is not primarily due to a lack of credit demand, but rather the inability of depository institutions to accommodate credit demand because of current and/or future capital adequacy concerns. FOMC "twisting the night away" is not going to do anything to remedy this situation.
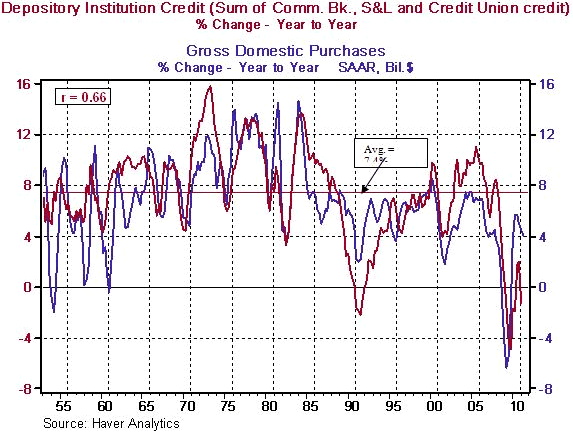
Historically, there has been a relatively high correlation (0.66) between year-over-year percentage changes in depository institution credit and year-over-year percentage changes in gross domestic purchases (see Chart 2). The post-WWII average growth in depository institution credit has been 7.4%. After having contracted at a post-WWII record of 4.9% year-over-year in the fourth quarter of 2009, as of the first quarter of this year, the most recent complete data available, growth in depository institution credit contracted by 1.3%. We are not claiming that 7.4% year-over-year growth in depository institution credit is the right rate of growth, but we are saying that contracting depository institution credit is the wrong trend if faster growth in domestic demand is desired.

Federal Reserve credit is a close substitute for depository institution credit. Both the Federal Reserve and depository institutions create credit "out of thin air." Credit created out of thin air allows the recipients of this credit to increase their current spending without requiring any other entities to curtail their current spending. Thus, net increases in the sum of Federal Reserve and depository institution credit carries with it the presumption of a net increase in domestic nominal expenditures. (See the September 7, 2011 edition of The Econtrarian, "If Some Dare Call It Treason, Was Milton Friedman a Traitor" for a fuller discussion of this and related issues.) If the FOMC wanted to do something "impactful" (George Cloos, is this really a word?) with regard to increasing the growth in domestic spending, it would resume quantitative easing. Rather than specifying that it would purchase $X hundred billion of long-term securities in the next Y months, the FOMC would specify that it would purchase securities of any maturity in whatever amounts were necessary to get the percentage change in combined Federal Reserve and depository institution credit into positive territory and keep it there. What should that rate of growth in combined credit be? Perhaps, growth in combined Federal Reserve and depository institution credit should be at a rate consistent with some desired rate of growth in nominal GDP? What would be a desirable rate of growth in nominal GDP? How about 5% annualized. Potential Real GDP growth is likely somewhere between 2-1/2% and 3%. Throw in 2% to 2-1/2% for goods/services price increases and you get 5%. OK, but what rate of growth in combined Federal Reserve and depository institution credit is consistent with 5% nominal GDP growth. Our back-of-the-envelope calculation of the consistent growth rate of combined Federal Reserve and depository institution credit is about 4-1/4%. If 4-1/4% is not the right answer, we are sure the army of econometricians employed by the Federal Reserve could come up with the correct one.
This is the decision we think the FOMC should arrive at after its September 20-21 meeting. This is not the answer we believe it will arrive at. Rather, we think the FOMC will decide to engage in some twisting of the yield curve. We do think this will have a marginal positive effect on the pace of economic activity. We believe that the securities dealers the Federal Reserve Bank of New York executes its trades with on behalf of the FOMC will see additional business as the New York Fed trading desk sells shorter-maturity securities and purchases longer-maturity securities. So, the bar and restaurant business in lower Manhattan might benefit from the FOMC's twisting policy as Wall Street fixed-income traders get bigger bonuses. But that's about it. We do believe, however, by early 2012, even the "Wrong-Way Corrigans" on the FOMC will see that it is time to resume quantitative easing. Assuming so, we do see that the pace of real GDP will pick up as 2012 progresses, but not enough to make a meaningful dent in the unemployment rate.
THE NORTHERN TRUST COMPANY ECONOMIC RESEARCH DEPARTMENT July 2011 SELECTED BUSINESS INDICATORS


Paul Kasriel is the recipient of the 2006 Lawrence R. Klein Award for Blue Chip Forecasting Accuracy
By Paul L. Kasriel
The Northern Trust Company
Economic Research Department - Daily Global Commentary
Copyright © 2011 Paul Kasriel
Paul joined the economic research unit of The Northern Trust Company in 1986 as Vice President and Economist, being named Senior Vice President and Director of Economic Research in 2000. His economic and interest rate forecasts are used both internally and by clients. The accuracy of the Economic Research Department's forecasts has consistently been highly-ranked in the Blue Chip survey of about 50 forecasters over the years. To that point, Paul received the prestigious 2006 Lawrence R. Klein Award for having the most accurate economic forecast among the Blue Chip survey participants for the years 2002 through 2005.
The opinions expressed herein are those of the author and do not necessarily represent the views of The Northern Trust Company. The Northern Trust Company does not warrant the accuracy or completeness of information contained herein, such information is subject to change and is not intended to influence your investment decisions.
Paul L. Kasriel Archive |
© 2005-2022 http://www.MarketOracle.co.uk - The Market Oracle is a FREE Daily Financial Markets Analysis & Forecasting online publication.


