Stock Market Crash 1929, Mystery Unraveled?
Stock-Markets / Financial Crash Sep 07, 2011 - 09:48 AM GMTBy: Submissions
 Wim Grommen writes: In the twenties of the last century the world, and especially the United States, experienced an economical high. As a result of this, share and stock prices rose to unprecedented heights, beyond reasonable values. The underlying economy had decreased in strength without this being reflected on the stock exchange. Investors were euphoric and stock prices were forced up against all economic logic. (1)
In my view the causes for the rise of the Dow Jones to unprecedented highs were the introduction of a new calculation method for the Dow on 1 October 1928, the introduction of the Dow-divisor, the extension of the Dow from 20 to 30 funds on 1 October 1928 and splitting the stock between October 1928 and November 1929 which was the last part of the acceleration phase of the second industrial revolution. These 3 factors caused the Dow to rise exponentially from 238 tot 381 points in de period October 1928 to September 1929, while the underlying economy strongly diminished in strength.
Transitions
Every production phase, civilization or other human invention goes through a so called transformation process. Transitions are social transformation processes that cover at least one generation. In this article I will use one such transition to demonstrate the position of our present civilization and its possible effect on stock exchange rates.
A transition has the following characteristics(2):
- it involves a structural change of civilization or a complex subsystem of our civilization
- it shows technological, economical, ecological, socio cultural and institutional changes at different levels that influence and enhance each other
- it is the result of slow changes (changes in supplies) and fast dynamics (flows)
A transition process is not fixed from the start because during the transition processes will adapt to the new situation. A transition is not dogmatic.
Four transition phases(3)
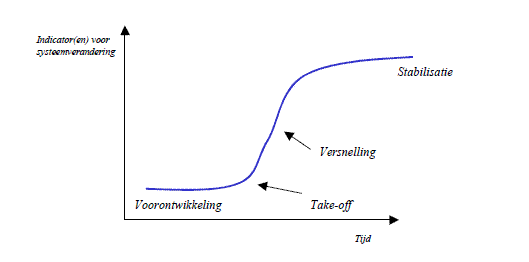
In general transitions can be seen to go through the S curve and we can distinguish four phases (see fig. 1):
- a pre development phase of a dynamic balance in which the present status does not visibly change
- a take off phase in which the process of change starts because of changes in the system
- an acceleration phase in which visible structural changes take place through an accumulation of socio cultural, economical, ecological and institutional changes influencing each other; in this phase we see collective learning processes, diffusion and processes of embedding
- a stabilization phase in which the speed of sociological change slows down and a new dynamic balance is achieved through learning
A product life cycle also goes through an S curve. In that case there is a fifth phase:
- the degeneration phase in which cost rises because of over capacity and the producer will finally withdraw from the market.

Indications of system transitions
- pre development
- take off
- acceleration
- stabilization
Figure 1: Four phases in a transition best visualized by means of an S curve.
When we look back into the past we see three transitions, also called industrial revolutions, taking place with far-reaching effect (4):
1. The first industrial revolution (1780 until circa 1850); the steam engine
2. The second industrial revolution (1870 until circa 1930); electricity, oil and the car
3. The third industrial revolution (1950 until ....); computer and microprocessor
The Dow Jones Industrial Average (DJIA) index is the oldest shares index in the United States. A select group of journalists of The Wall Street Journal decide which companies are included in the most influential stock exchange index in the world.
Unlike most other indices the Dow is a price average index. This means that shares with a high price have a great influence on the movements of the index.
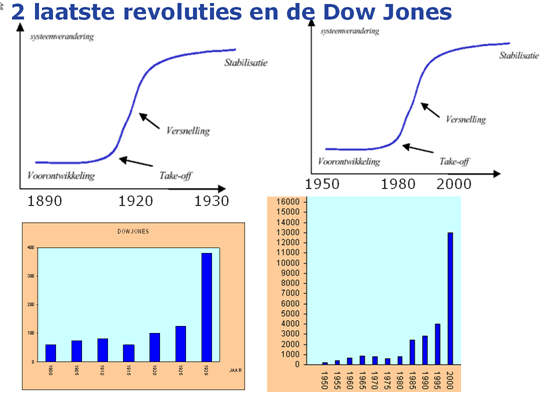
Calculating stock index values such as the Dow and presenting the index in a historical graphs is a perfect way of indicating which phase an industrial revolution is in.

Indications of system transitions
- pre development
- take off
- acceleration
- stabilization
Figure 2: The two most recent revolutions and the Dow Jones index
Dow Jones-index (graph) was (is) a fata morgana.
In many graphs the y-axis is a fixed unit, such as kg, meter, liter or euro. In the graphs showing the stock exchange values, this also seems to be the case because the unit shows a number of points. However, this is far from true! An index point is not a fixed unit in time and does not have any historical significance.
An index is calculated on the basis of a set of shares. Every index has its own formula and the formula gives the number of points of the index. Unfortunately many people attach a lot of value to these graphs which are, however, very deceptive.
The Dow was first published in 1896. The index was calculated by dividing the sum of the shares by 12:
Dow-index_1896 = (x1 + x2+ ..........+x12) / 12
An index is calculated on the basis of a set of shares. Every index has its own formula and the formula results in the number of points of the index. However, this set of shares changes regularly. It is therefore very strange that different sets of shares are represented by the same unit.
After a period of 25 years the value of the original set of 12 apples is compared to the value of a set of 30 pears. In 1929 only 2 of the original 12 companies of the Dow were still present.
The most remarkable characteristic is of course the constantly changing set of shares. Generally speaking, the companies that are removed from the set are in a stabilization or degeneration phase. Companies in a take off phase or acceleration phase are added to the set. This greatly increases the chance that the index will rise rather than go down. This is obvious, especially when this is done during the acceleration phase of a transition. In 1916 the Dow was extended to 20 companies; 4 companies were taken out and 12 were added.
Dow-index_1916 = (x1 + x2+ ..........+x20) / 20
This way of calculating the index actually creates a kind of pyramid scheme. All goes well as long as companies are added that are in their take off phase or acceleration phase. At the end of a transition there will be fewer companies in those phases.
The shares of a number of companies were split during the years and for those shares a factor was added to the calculation. The formula is as follows (American Can is multiplied by 6, General Electric by 4).
Dow-index_1927 = (6.x1 + 4.x2+ ..........+x20) / 20
Things take a bizarre turn with the changes to the Dow Jones of 1 October 1928.
On 1 October 1928 the Dow Jones is enlarged to 30 shares.
Because all calculations are done by hand, the calculation formula of the index is simplified. The Dow Divisor is introduced. The index is calculated by dividing the sum of the share values using the Dow Divisor.
Because the value on 1 October 1928 must remain the same, the Dow Divisor is set at 16.67. The index graphs of before and after 1 October be a continuous line.
Dow-index_okt_1928 = (x1 + x2+ ..........+x30) / 16.67
On 1 October 1928 the value of the Dow is 239, so the sum of the shares is 3984 dollars. From that moment on an increase (or decrease) of the set of shares results in almost twice as many (or fewer) index points. In the old formula the sum would have been divided by 30.
With every change in the set of shares used to calculate the Dow, the value of the Dow Divisor also changes. This is done because the index which is the result of two different sets of shares at the moment the set is changed must be the same for both sets at that point in time. The same thing happens when shares are split. In the fall of 1928 and spring of 1929 8 shares are split decreasing the Dow Divisor to 10.47.
Dow-index_sept_1929 = (x1 + x2+ ..........+x30) / 10.47
From that moment on a an increase (or decrease) of the set of shares results in almost three times as many (or fewer) index points as a year before. In the old formula the sum would have been divided by 30. The Dow’s highest point is on 3 September 1929 at 381 points.
So the extreme increase followed by an extreme decrease of the Dow in the period 1920 – 1932 was primarily caused by changes to the formula, the constant changes to the set of shares during the acceleration phase of the second industrial revolution and splitting of s`hares during this period. Because of these changes in the Dow investors were wrong footed. The companies whose shares constituted the Dow index at that time also continued into the stabilization and degeneration phase.
Déjà vu
Dow Jones Industrial Average

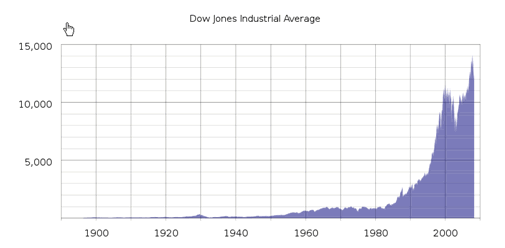
Figure 3 Exchange rates of Dow Jones during the latest two industrial revolutions. During the last few years the rate increases have accelerated enormously.
During the acceleration phase of the third industrial revolution, starting in 1980 with the appearance of the microprocessor, history repeated itself. The set of shares making up the Dow was almost completely replaced. Many shares were split which changed the Dow Divisor considerably. At the moment the Dow Divisor is 0,132319125, whereas this divisor was still more than 1 in 1985.
Dow-index_1985 = (x1 + x2 + ........+x30) / 1.116
Dow-index_2009 = (x1 + x2 + ........ + x30) / 0,132319125
This explains the exponential rise of the Dow graph in the nineties. A rise in shares of 1 dollar of the set of shares in 2009 actually results in 8.4 more index points than in 1985 (the opposite happens when the shares go down). This explains why we have such extreme movements of the Dow in the previous period. At moment the Dow is at 9665 points, if we were to use the 1985 formula this would be 1150 points. Again investors have been lead onto the wrong path.
The real melt down of the Dow took place after the stock market crash of October 1929. During the period 1930 – 1932 the Dow continued to decrease from 230 to 41 points in the end. The crucial question is of course, whether the current underlying economy is strong enough to keep the Dow at its present level. Will the companies that make up the Dow not continue into the the stabilization and degeneration phase? Will there be enough new companies to act as new carriers of the Dow? And will that happen?
I call on the financial community to have a critical look at the formula used to calculate the Dow. If the present formula is retained, investors will be misguided with every new transition.
Wim Grommen
Sources used:
(1) http://nl.wikipedia.org/wiki/Beurskrach_van_1929
(2) Transities & transitiemanagement, casus van een emissiearme
energievoorziening, Prof. dr. ir. Jan Rotmans e.a. .
(3) Transities & transitiemanagement, casus van een emissiearme
energievoorziening, Prof. dr. ir. Jan Rotmans e.a. .
(4) Geschiedenis Werkplaatssite van Wolters-Noordhoff
© 2011 Copyright Wim Grommen - All Rights Reserved
Disclaimer: The above is a matter of opinion provided for general information purposes only and is not intended as investment advice. Information and analysis above are derived from sources and utilising methods believed to be reliable, but we cannot accept responsibility for any losses you may incur as a result of this analysis. Individuals should consult with their personal financial advisors.
© 2005-2022 http://www.MarketOracle.co.uk - The Market Oracle is a FREE Daily Financial Markets Analysis & Forecasting online publication.


