


Charts and Economic Data Point to a Bloody September for Stock Markets
Stock-Markets / Financial Markets 2011 Sep 05, 2011 - 06:46 AM GMTBy: Capital3X

 September is known to slay the mighty and yet it may just be the best opportunity of all months to make strong returns if one is able to realign portfolio to ride the momentum.
We will analyze charts from the Treasury market, S&P 500 Index, Volatility indices and AUD/USD to understand the market positioning. The data over the last couple of weeks has been negative the least to say.
The bull run seen the treasury market over the last 2 months show no signs of moderating. The TLT (20 year) daily charts:
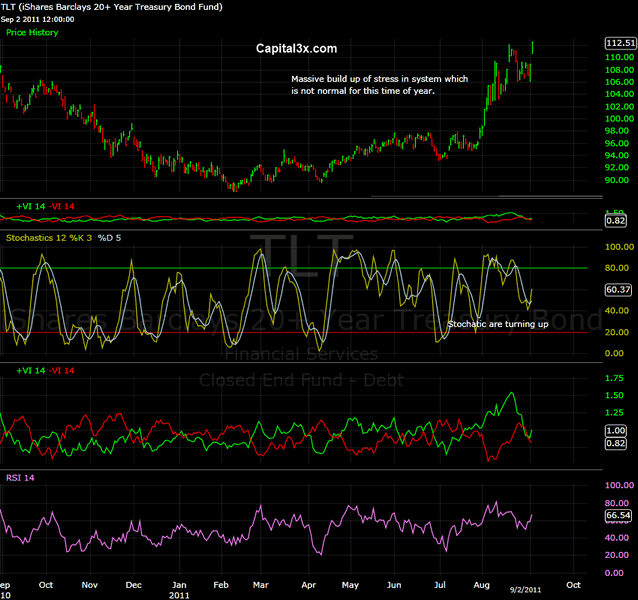
The breakout by the Treasury market (IEI, IEF, TLT, TIP) to the upside is suggesting that stress is building in the system, as investors continued to flock to safety despite already record low yields. It is more a story of investors seeking return on capital but rather a return of capital.
TLT has now breached the key level of 100 and has closed at 112 highest closing level seen since 2008.
TLT is now well above the 50dma thus establishing the intermediate bull run in treasuries
Stochastic are well and truly above 50 and are turning up pointing to further gains
Vortex is indicating a continuation of the strong run seen since July 2011
The Monthly charts are stamping the findings of the daily charts:
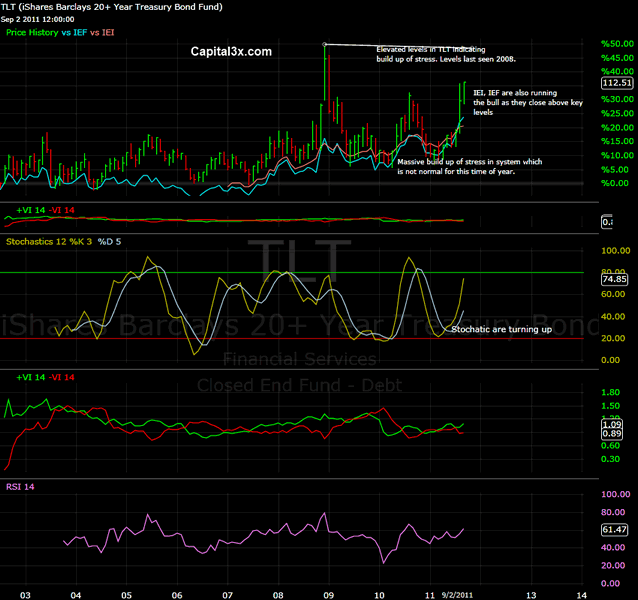
IEF (3-7 year treasury) and IEI (10 year treasury) are have also run up 24% and 20% in July and August, thus accentuating the stress in the system.
Given the extreme flows into bond markets, it is only a matter of time before we see S&P breaking down. Unless treasuries turn down over the next few days, we could be in for a real nasty bloody month of September or even October.
The charts for S&P is now pointing to heavy losses over the course of the next few weeks
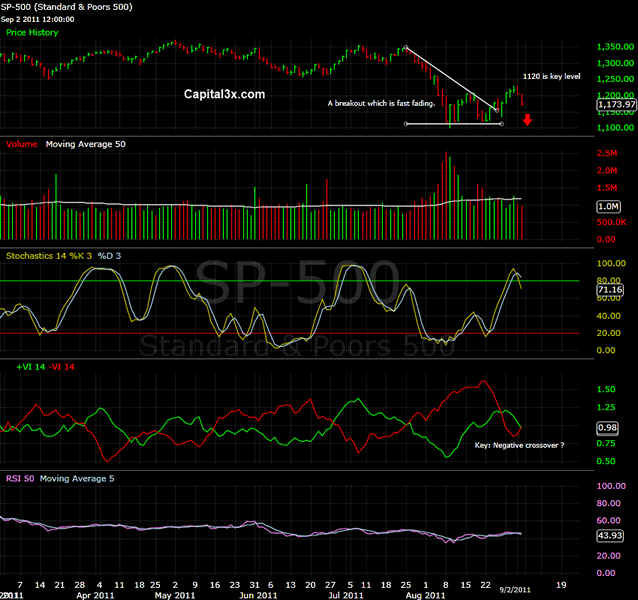
The stochastic having run strongly to 71 is now pointing downwards giving a strong indication of a false break in S&P 500. The vortex indicator is now also about to have the negative vortex to crossover the positive vortex which will further strengthen the case for a correction in S&P 500.
The AUD/USD, a prime proxy for risk ON trade, has broken down the key levels of 1.0650. We may prematurely conclude that a retest of 0.9940 is on the cards in which case, we are setting up for blood on the streets.
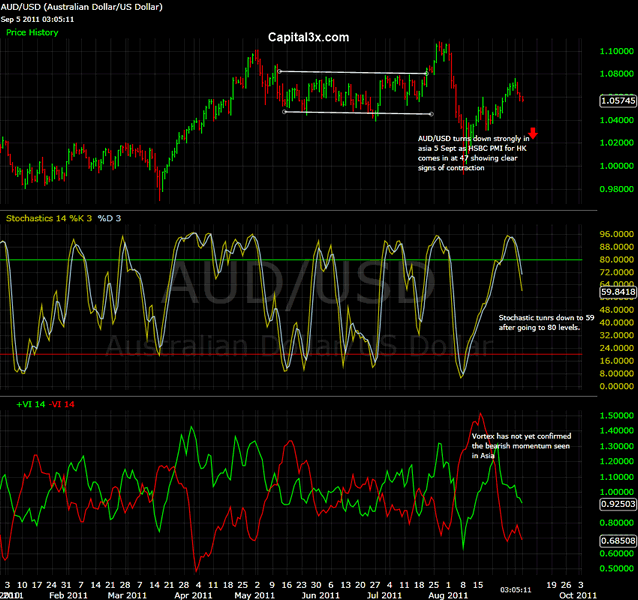
AUD/USD has broken key levels of 1.0650. A close below 1.06 could spell strong bearish momentum for equity markets globally.
The markets have been exposed to severe negative economic data over the course of the last 5 days. Recap here should speak volumes of the state of world economy.
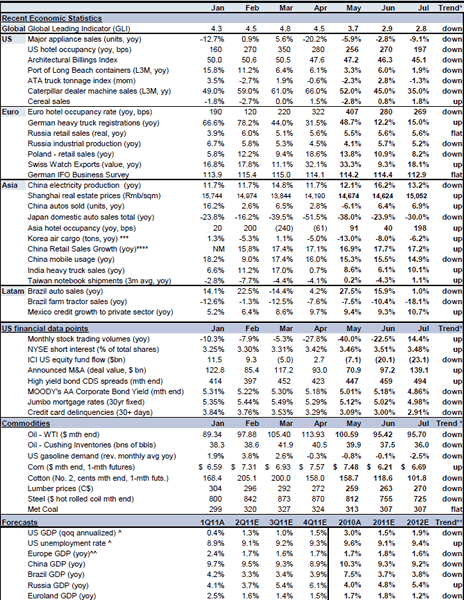
Source: The world is slwoing
Unemployment
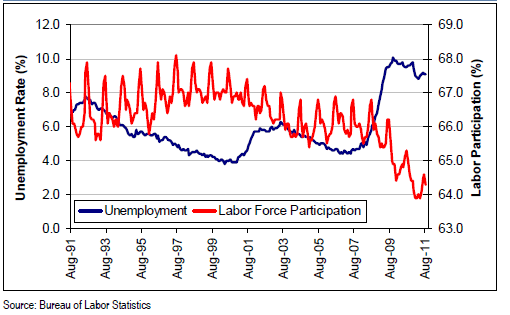
Initial jobless claims dropped 12K to 409K last week, roughly in line with the consensus. Separately, the ADP report showed that the private sector created 91K jobs in August, versus 109K in July and the 100K Street estimate. However, nonfarm payrolls had no net gains last month. The public sector shed 17K jobs while the private sector added 17K. Notable is that the Verizon strike caused a 48K drop in information industry jobs for August. With workers returning at the end of August, September payrolls should witness a corresponding lift.
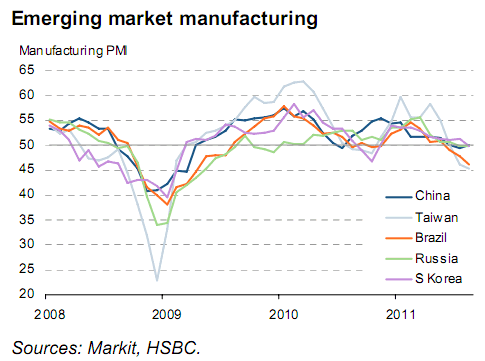
Manufacturing slowing globally
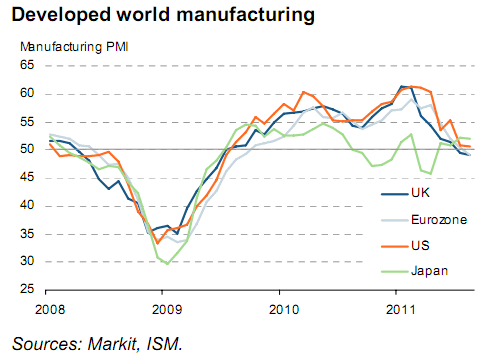
While Developed markets slowed, emerging markets too are scrapping with 50 levels.
The JPMorgan Global Manufacturing PMI fell from 50.7 in July to 50.1 in August. The near-stagnation signalled by the index was the worst performance since the recovery began two years ago and represents a big turnaround in the growth profile of the manufacturing sector compared to the post-recession peak of 57.4 seen in February.
Personal Spending
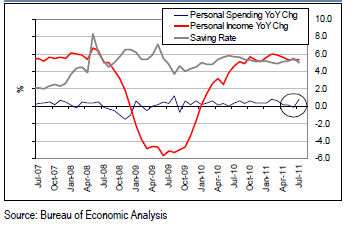
July personal spending increased 0.8%, which is the biggest gain in five months. Meanwhile, the savings rate dropped to 5% from 5.5% in June. Core PCE index showed core inflation accelerated to 1.6% from 1.4% in June though the level remains below the Fed’s long-term target. Despite bad weather and a volatile stock market, August retail sales rose 5.5%, marking the 24th consecutive month for YoY increases. The back-to-school season appears to be off a good start. Interestingly, retailers serving better-off consumers, including Saks and Nordstrom, reported stronger sales versus the more middle-market peers.
Case Schiller House prices
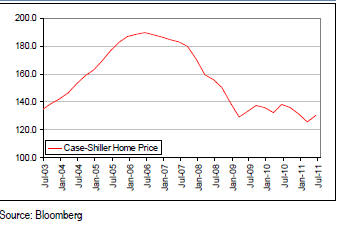
Pending home sales fell 1.3% MoM in July, roughly in line with the consensus. However, the Case-Shiller home price index ticked up 3.6% in Q2 versus Q1. The housing market is likely to remain weak given the elevated unemployment rate, a large pipeline of foreclosed properties and tight credit. That said, expectations are low, so big negative surprises should be limited.
The string of bad data points over the last couple of weeks has now stoked fears of a strong double dip recession which not be entirely solved by a small QE3 but may need a larger size of asset purchases.
Given that Asia this morning, the only horse riding the growth, has also started to point to impending slow down, with HSBC PMI for HK coming in at 47. Any level below 50 is a sign of contraction.
Ultimately all this could just be a precursor to FED turning on QE tap once again in a desperate bid to re start a slowing economy. Strong build of stress in the treasury markets, negative setups in SP 500 and bearish indicators in AUD/USD are all pointing to further fall.
Given the charts and data, we can see important 10-20% setups across asset classes including forex, equities and commodities. For the record, we made 1408 pips of profit in August and 1002 pips in July. All this at a mere VaR of 3%.
Premium subscribers can login and check the latest trading portfolio for 5 September
Our feeds: RSS feed
Our Twitter: Follow Us
Kate
Capital3x.com
Kate, trading experience with PIMCO, now manage capital3x.com. Check performance before you subscribe.
© 2011 Copyright Capital3X - All Rights Reserved
Disclaimer: The above is a matter of opinion provided for general information purposes only and is not intended as investment advice. Information and analysis above are derived from sources and utilising methods believed to be reliable, but we cannot accept responsibility for any losses you may incur as a result of this analysis. Individuals should consult with their personal financial advisors.
© 2005-2022 http://www.MarketOracle.co.uk - The Market Oracle is a FREE Daily Financial Markets Analysis & Forecasting online publication.