The Gold Price Parabola And Silver Rocket Update
Commodities / Gold and Silver 2011 Sep 05, 2011 - 03:13 AM GMTBy: GoldRunner
 Gold has been rocketing up to, and through, the price levels that we laid out many months ago (although a couple of months later than we had expected). This is the equivalent move for Gold that we have recently seen Silver making. As Gold starts to rise more parabolic on the log chart, it creates a very important consequence for the Precious Metals (PM) stock indices since they are heavily weighted in Gold Producers. Suddenly, the price of Gold is rocketing up through, and above, the mining costs of the Gold Producers and triggering heavy leverage for the earnings of those Gold Miners.
Early in the week of August 8th we laid out for subscribers to our service (see here for subscription details) our expectations for a major double bottom in the HUI index and the GDX ETF at around the 100 week exponential moving average - the start of the first of three major Precious Metals Stock momentum moves to come. Since that time both the HUI and the GDX have created the important sequence of price rises and re-retests to confirm the start of the momentum move, resulting in a very important break-out in both indices this past Friday.
THE GOLDEN PARABOLA
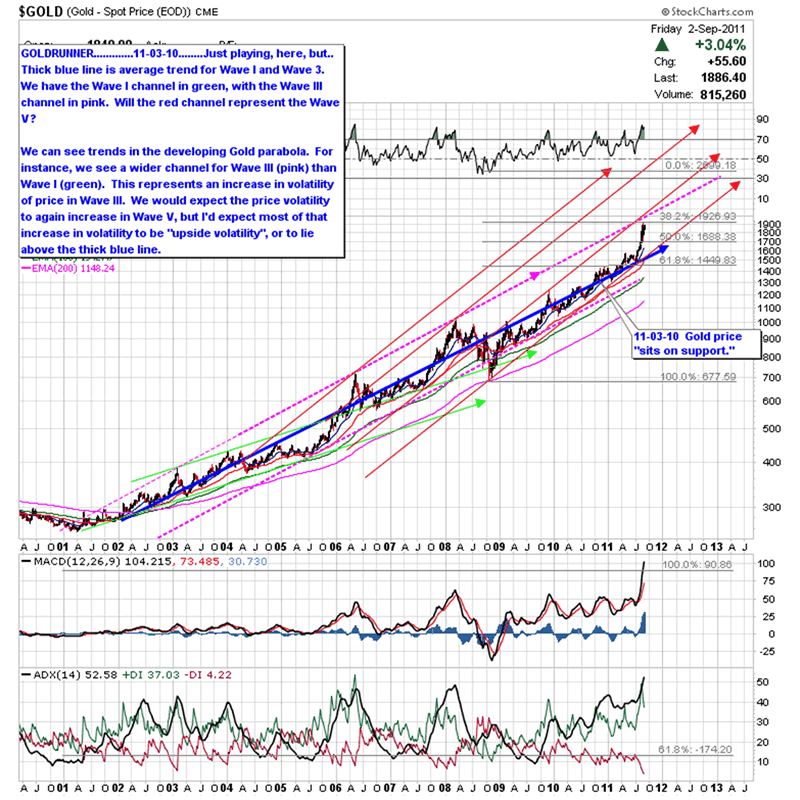
We can see on the chart of Median Line Log Gold below, Gold started a sharp rise right about the time that the debt ceiling was raised. That announcement provided the need for further debt monetization via further aggressive dollar inflation. The timing of the start of the higher angled rise came right on time per the 70’s chart for Gold. Many have been looking for Gold to re-trace heavily from this run, but we believe that we are seeing the early start of a more parabolic move for Gold that will take Gold much higher by year-end, or into early 2012.
The next upside target for Gold will likely be up to around the $2250 target we have already laid out, then up much higher after a short correction, before Gold takes a bit of a breather for a few months.
So far, Gold has shot up to $1915, then re-traced to our first support line on the arithmetic Elliott Wave Channel chart that we have shown in the past. We expect that line of support to hold since Gold has barely scratched the surface of the similar rise that Silver recently made as it busted upward from $17.50 to rocket up to $49.50.

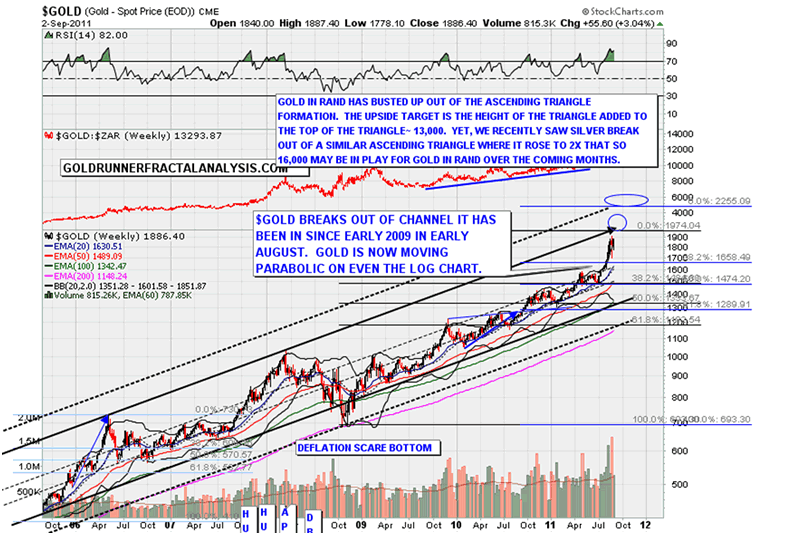
The next Gold chart is a log chart showing that the top dotted angled line that lies in the area of $2250 is analogous to how far Gold fell out of the main channel during the deflation scare back in late 2008. We expect that top dotted line to serve as the next upside resistance level where we will see a bit of a correction before Gold continues to explode higher into year-end, or into early next year. All of the metrics of Gold’s rise up to this point are mute once Gold busts out in a parabolic form on the log chart as seen in the late 70’s.

THE SILVER ROCKET
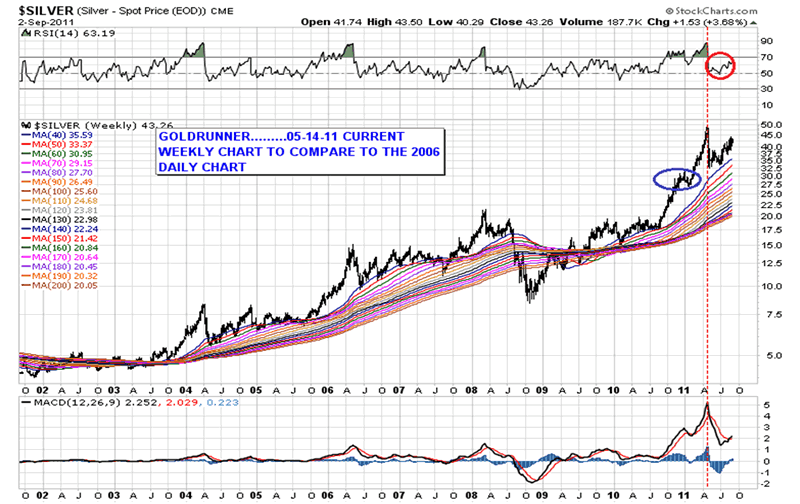
Back when Silver was trading around $30 we laid out targets for Silver in a multiple topping process as seen in the late 70’s and in 2006. At the time we laid out a range of $48 to $49 for the first resistance line for Silver into May/June with the potential for Silver to spike up to as high as $56.
Silver hit that first line of resistance with traders coming in overnight on a Sunday in April to hammer Silver down to a very similar percentage reaction as we saw in 2006. At this time Silver is rising back up as it did in 2006 to reach for the next high in the expected multiple top formation.
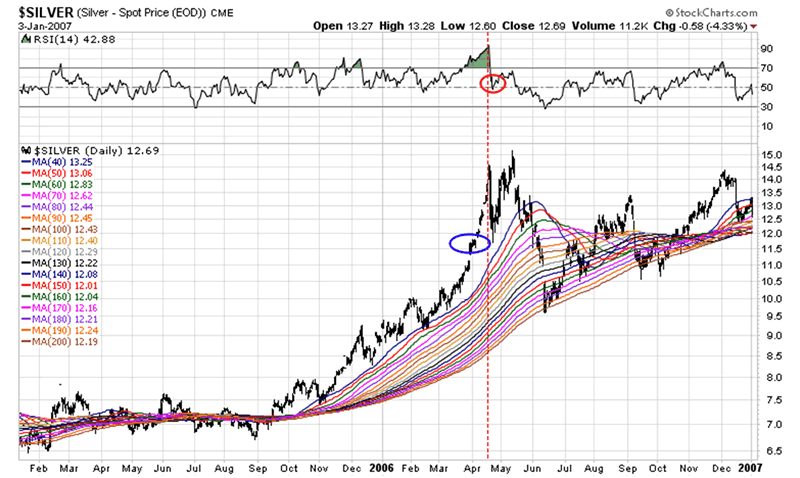
In the 2006 chart of Silver, below, we can see the sharp correction that is very similar to the recent price reaction. In fact, the RSI and price pattern for Silver are almost identical twins in the two periods as Silver moves back up to expected new highs toward the $52 to $56 area.
Some were calling the similar Silver reaction to that in 2006 as a crash and the end of the Silver Bull. The arithmetic ratio target for Silver off of the 70’s chart is up to around $150 for the PM Bull, yet, since the current PM Bull is at a higher Elliott Wave Degree than the 1970’s, we perceive the potential for Silver’s high to come in at multiples of the arithmetic target. If true, then we will should see similar multiples for Gold and for the PM Stock Indices, also.
2006 SILVER

THE CURRENT SILVER ROCKET CHART

SUMMARY/ REVIEW
The nature of the price rise for Gold, and for Silver, are somewhat different as seen in the current and 1970’s charts for each. The chart of Silver tends to rip higher in sudden emotional price drives whereas the rise of Gold tends to be a much smoother parabolic form. The price of Gold is the true reflection of the amount of dollar devaluation in progress as we have often noted in the past so the US Dollar Index becomes a fairly impotent guide to dollar inflation in this part of the cycle where global competitive currency devaluations are in full swing.
At this point, we believe that the parabolic rise in Gold and in Silver still have a very long way to go as measured directly off of the late 1970’s Charts. In fact, we expect the arithmetic ratio targets for Gold and for Silver, based on the late 1970’s rise for each, to get blown away since we are seeing a logarithmic rise in dollar inflation compared to the late 1970’s.
We have just hit the point where the more parabolic rise in Gold set off the leverage for the Gold Stocks in the late 1970’s. Therefore, we expect the real parabolic PM Stock Index Bull is just now commencing. We expect that the break-out last Friday will eventually be seen as the first of three PM Stock momentum runs yet to come. Fasten your seatbelts!
To keep abreast of daily developments in what is happening with physical gold and silver, various PM indices and specific gold and silver mining and royalty stocks please subscribe to our service here. To read more of public access articles please go here.
GOLDRUNNER
Goldrunner has also posted this article on the public side of www.GoldrunnerFractalAnalysis.com
Lorimer Wilson is the Editor-in-Chief of www.FinancialArticleSummariesToday.com and www.munKNEE.com and will soon be offering a FREE weekly “Top 100 Stock Market, Asset Ratio & Economic Indicators in Review”. To sign up contact him at editor@munKNEE.com .
Disclaimer: Please understand that the above is just the opinion of a small fish in a large sea. None of the above is intended as investment advice, but merely an opinion of the potential of what might be. Simply put:
The above is a matter of opinion and is not intended as investment advice. Information and analysis above are derived from sources and utilizing methods believed reliable, but we cannot accept responsibility for any trading losses you may incur as a result of this analysis. Comments within the text should not be construed as specific recommendations to buy or sell securities. Individuals should consult with their broker and personal financial advisors before engaging in any trading activities. Do your own due diligence regarding personal investment decisions.
© 2005-2022 http://www.MarketOracle.co.uk - The Market Oracle is a FREE Daily Financial Markets Analysis & Forecasting online publication.


