


Stock Market Big Picture
Stock-Markets / Stocks Bear Market Sep 04, 2011 - 10:34 AM GMTBy: Tony_Caldaro

 What started off as a promising week for the equity markets ends mixed in the US: SPX/DOW -0.3%, and the NDX/NAZ +0.2%. In between, the market gapped up monday morning from friday’s SPX 1177 close. Then hit SPX 1231 on wednesday only to gap down friday ending the week at SPX 1174. Economic reports continued to be slanted to the downside. On the upswing: personal income/spending, PCE prices, the Case-Shiller index, factory orders, auto sales, the m1-multiplier, and jobless claims improved. On the downswing: pending home sales, construction spending the Chicago PMI, ISM manufacturing, the ADP index, monthly Payrolls, the monetary base, the WLEI, and consumer confidence plunged. Asian markets gained 1.9%, European markets gained 1.7%, the Commodity equity group gained 3.7%, and the DJ World index rose 1.6%. Next week we have the FED’s Beige book, ISM services, and Consumer credit.
BIG PICTURE: Secular bear cycle
Let’s look at the big picture, and put the process of getting there aside for the moment.
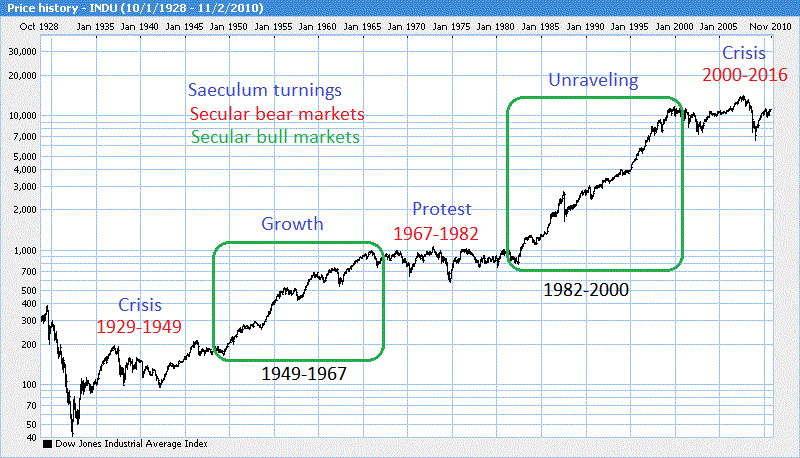
We last published this chart in this piece, which was more about cycles in humanity and politics than markets: http://caldaro.wordpress.com/2010/11/04/politics-and-secular-bullbear-markets/. The Saeculum turnings are described in the article. What is important now is the Secular bull/bear markets. Notice the two boxed areas are 18 year Secular bull markets. The next one is on the way, but we are not there yet. The three other time periods are with choppy sideways activity: 1929-1949 (excluding the GSC crash), 1967-1982 and 2000-2016(?). These are three Secular bear markets alternating between deflationary forces (1929) to inflationary forces (1967), and then back to deflation (2000). Wonder why Bond rates are so low? We’ve been in a deflationary environment for over a decade now.
The typical Secular bear cycle unfolds as follows. The cycle begins at a preliminary peak, i.e. 1967 and 2000. A bear market follows: i.e., the 1967-1970 Nifty 50 collapse and the 2000-2002 Nasdaq 100 collapse. The market then hits its primary peak approaching the midpoint of the cycle, (all time high), i.e. 1973 and 2007. A nasty bear market follows creating the actual price low of the cycle, i.e. 1973-1974 and 2007-2009. A short lived bull market then follows, i.e. 1974-1976 and 2009-2011. Finally the market enters another bear market to end the Secular bear cycle. We have entered that bear market now.
We omitted comparison to the 1929-1949 Secular bear cycle for two reasons. First, the collapse between 1929 and 1932 was on a Grand Supercycle scale. The market lost 89% of its value in just those three years. Events like that only come along about every 200 years. The 2007-2009 bear market, for example, was of a Supercycle degree as the market lost 58% of its value. It was certainly the largest bear market since 1929, but not of the same degree. The second reason was, the normal 16 year bear cycle was extended 4 years by World War II. However, even that bear cycle matched up with the 13 year commodity bull cycle.
Commodity bull markets only occur during equity bear Secular cycles. The three commodity bull Secular cycles: 1933-1946, 1967-1980 and 2001-2014(?). Notice how the previous equity bear cycles ended 2-3 years after the commodity bull market ended, i.e. 1949 and 1982. This is exactly what we will be looking for over the next few years to identify the beginning of the new equity 18 year secular bull market. One could conclude they should be invested in equities during its Secular bull market. Then wait a year or two and invest in commodites during their Secular bull market. A year or two later and it’s back to equities. What do you then do with all the spare time? Help others learn how to help themselves. In this world it is not what you get that’s important, it’s what you give.
LONG TERM: bear market highly probable
When we review the wave structure from the March 2009 SPX 667 low we can count a detailed Primary wave I, then simple Primary waves II – V. Since Primary wave IV (SPX 1249) did not overlap Primary wave I (SPX 1220) and Primary waves II and IV alternated in wave structure, we have a clear five wave bull market peaking at SPX 1371 in May 2011. The price activity since that high confirms that five waves did complete in May. Even the technicals have switched from bull market mode to bear market.
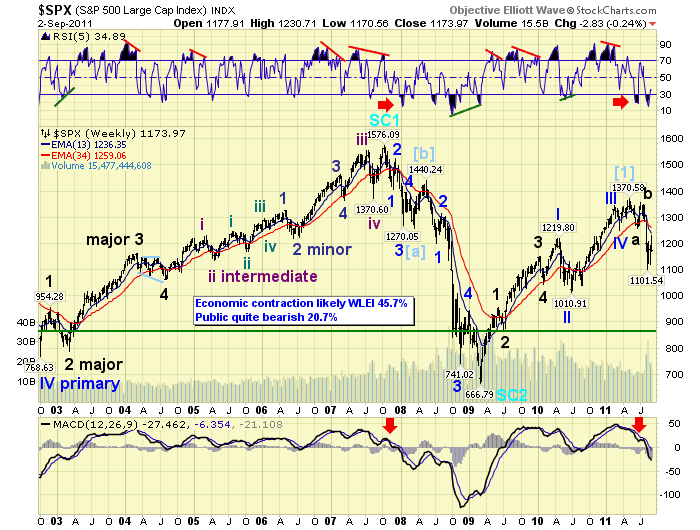
Notice how the weekly MACD remained above neutral during the last two bull markets, then broke into negative territory after the following bear markets began. Also notice during both bull markets the RSI never got extremely oversold. But it gets extremely oversold during the bear markets.
Last weekend we posted a chart displaying how oversold this market had become, even for a bear market, at the recent SPX 1102 low. We then assumed that SPX 1102 was a significant low, and the market would now enter a two month counter-trend rally retracing about 50% of the entire decline thus far. The decline SPX 1371 to 1102 was 269 points. Therefore a 50% retracement would carry the market to SPX 1237. Surprisingly, the market accomplished that task in only three weeks when it hit SPX 1231 this wednesday. Don’t be fooled, B wave rallies can often look like new bull markets.
MEDIUM TERM: downtrend low may have been SPX 1102
We expect the current, highly probable, bear market to unfold in three Primary waves ABC. The two legs down, A and C, can take the form of five waves down or three. The B wave will always be three waves up. After careful review of the technicals we had posted our preferred three wave down count on the SPX charts, and our alternate count of five waves down on the DOW charts. After this week’s activity we still feel the SPX count is the preferred count.
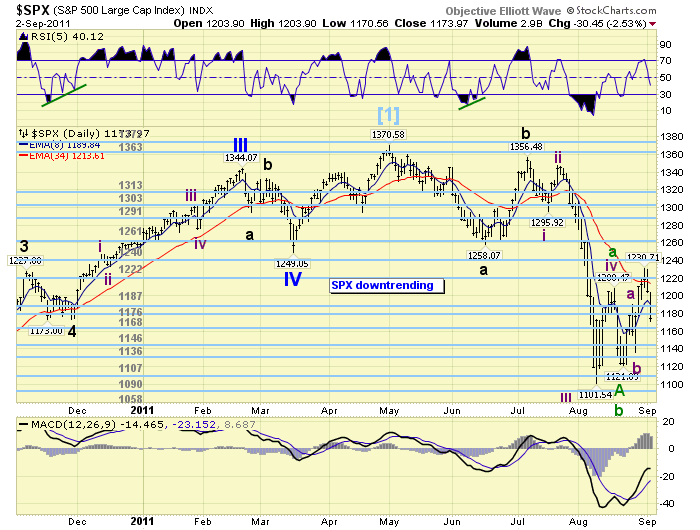
The market downtrended from SPX 1371 to 1258 in June, and we labeled that wave Major wave a. The uptrend that followed to SPX 1356 in July was labeled Major wave b. The next downtrend, from that high, we anticipated ended in August at SPX 1121 (orthodox low SPX 1102) and have labeled ‘tentatively’ Primary wave A (Major wave c). Until we get an OEW uptrend confirmation we can not be certain. We counted that decline as five waves down, just like Major wave a, but with a failed fifth wave.
After that low we observed an abc rally to SPX 1231 this wednesday, and then a decline to 1171 on friday. This decline confirmed its was an abc rally when it overlapped SPX 1191. This three wave rally we labeled Major wave a of Primary wave B. Since we have not had an uptrend confirmation yet there is also another possibility. SPX 1102 may have only ended Intermediate wave iii of Major wave c, and all the activity up to 1231 was Intermediate wave iv. We have added that count, in green, on the SPX charts. A decline below SPX 1121 would confirm that count, and a continuation of the downtrend.
Focusing on the preferred count. With a three month Primary wave A completed at SPX 1121. We should now observe an abA-B-abC two month Primary wave B. The recent rally to SPX 1231 fits the abA scenario and we labeled it Major wave A. The Major wave B pullback part should be underway now. Then, when it completes, we should get another abc rally to complete Major wave C and Primary wave B. This could occur this month, it’s still a fast market, or next. After Primary wave B completes we should start the next three wave (trend) structure down. We did some fibonacci work and this scenario aligns quite nicely with our two support zones for the bear market: SPX 1011 and SPX 869. When we get more market data we’ll post that information.
SHORT TERM
Support for the SPX is at 1168 and then 1146, with resistance at 1176 and then 1187. Short term momentum ended the week extremely oversold. The recent rally from SPX 1121, Primary A, took the form of an abc (1191-1136-1231). Wave c was 1.382 times wave a. The total rally was 110 points, and we labeled it Major A. Normal retracement levels for Major B are 50% (SPX 1176) and 61.8% (SPX 1163). On friday we hit right in between those two levels, which also represent the 1176 and 1168 pivots. With an extremely oversold short term condition there is a good chance the market will either bottom here, to complete Major B. Or, rally and then make a slightly lower low for a positive divergence low. Since the US market is closed on monday we’ll get a better idea after the foreign markets close.
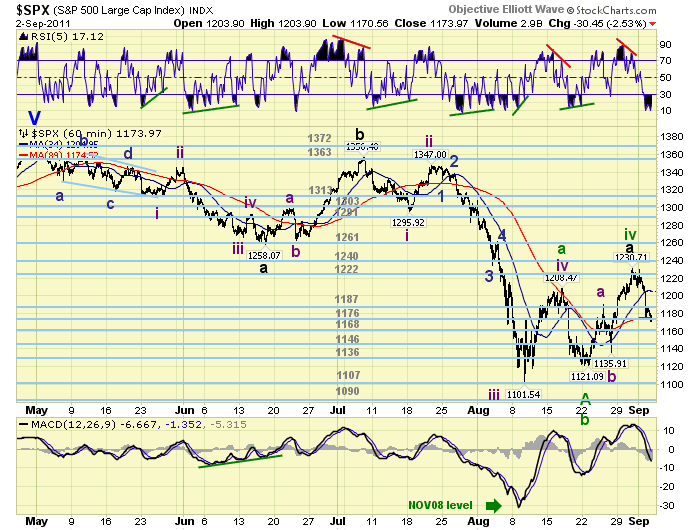
The current decline can go all the way down to the OEW 1136 pivot, which was the previous Intermediate wave A decline and not change the potential Major wave B scenario. However, if that pivot’s range were to fail then the alternate Intermediate wave iv high at SPX 1231 would come into play, and the market would then be in Intermediate wave v of an ongoing downtrend. We’ll keep you posted, as usual, day by day as this market unfolds. Best to your trading!
FOREIGN MARKETS
The Asian markets were mostly higher for a net gain of 1.8%. No confirmed uptrends yet.
The European markets were mostly higher for a net gain of 1.7%. Again no confirmed uptrends yet.
The Commodity equity group were all higher for a net gain of 3.7%. No confirmed uptrends here either.
The DJ World index gained 1.6%.
COMMODITIES
Bonds rallied to new uptrend highs this week gaining 0.8%. The 10YR yield closed at 1.996%, and the 30YR is down to 3.31%.
Gold rallied again this week, +3.0%, with all of it on friday’s 3.2% rally. Silver and Gold are getting very close to extending their uptrends.
Crude gained 1.3% despite a 2.3% decline on friday. It remains trying to establish an uptrend.
The USD gained 1.3% on the week and is now uptrending. The EUR lost 2.0% on the week, and the JPY declined 0.6%. We’re looking for a major reversal in the currencies to be underway soon.
NEXT WEEK
A light economic calendar heading into the holdiay shortened week. On tuesday ISM services at 10:00. On wednesday the FED’s beige book, then on thursday weekly Jobless claims, the Trade deficit, and Consumer credit. Friday ends the week with Wholesale inventories. As for the FED. FED chairman Bernanke gives a speech on thursday, in Minn. on the US Economic Outlook. With two FED governors coming out this week for QE 3, this speech could be a market mover. Best to you and yours this holiday weekend!
CHARTS: http://stockcharts.com/...
http://caldaroew.spaces.live.com
After about 40 years of investing in the markets one learns that the markets are constantly changing, not only in price, but in what drives the markets. In the 1960s, the Nifty Fifty were the leaders of the stock market. In the 1970s, stock selection using Technical Analysis was important, as the market stayed with a trading range for the entire decade. In the 1980s, the market finally broke out of it doldrums, as the DOW broke through 1100 in 1982, and launched the greatest bull market on record.
Sharing is an important aspect of a life. Over 100 people have joined our group, from all walks of life, covering twenty three countries across the globe. It's been the most fun I have ever had in the market. Sharing uncommon knowledge, with investors. In hope of aiding them in finding their financial independence.
Copyright © 2011 Tony Caldaro - All Rights Reserved Disclaimer: The above is a matter of opinion provided for general information purposes only and is not intended as investment advice. Information and analysis above are derived from sources and utilising methods believed to be reliable, but we cannot accept responsibility for any losses you may incur as a result of this analysis. Individuals should consult with their personal financial advisors.
© 2005-2022 http://www.MarketOracle.co.uk - The Market Oracle is a FREE Daily Financial Markets Analysis & Forecasting online publication.