Most Popular
1. It’s a New Macro, the Gold Market Knows It, But Dead Men Walking Do Not (yet)- Gary_Tanashian
2.Stock Market Presidential Election Cycle Seasonal Trend Analysis - Nadeem_Walayat
3. Bitcoin S&P Pattern - Nadeem_Walayat
4.Nvidia Blow Off Top - Flying High like the Phoenix too Close to the Sun - Nadeem_Walayat
4.U.S. financial market’s “Weimar phase” impact to your fiat and digital assets - Raymond_Matison
5. How to Profit from the Global Warming ClImate Change Mega Death Trend - Part1 - Nadeem_Walayat
7.Bitcoin Gravy Train Trend Forecast 2024 - - Nadeem_Walayat
8.The Bond Trade and Interest Rates - Nadeem_Walayat
9.It’s Easy to Scream Stocks Bubble! - Stephen_McBride
10.Fed’s Next Intertest Rate Move might not align with popular consensus - Richard_Mills
Last 7 days
THEY DON'T RING THE BELL AT THE CRPTO MARKET TOP! - 20th Dec 24
CEREBUS IPO NVIDIA KILLER? - 18th Dec 24
Nvidia Stock 5X to 30X - 18th Dec 24
LRCX Stock Split - 18th Dec 24
Stock Market Expected Trend Forecast - 18th Dec 24
Silver’s Evolving Market: Bright Prospects and Lingering Challenges - 18th Dec 24
Extreme Levels of Work-for-Gold Ratio - 18th Dec 24
Tesla $460, Bitcoin $107k, S&P 6080 - The Pump Continues! - 16th Dec 24
Stock Market Risk to the Upside! S&P 7000 Forecast 2025 - 15th Dec 24
Stock Market 2025 Mid Decade Year - 15th Dec 24
Sheffield Christmas Market 2024 Is a Building Site - 15th Dec 24
Got Copper or Gold Miners? Watch Out - 15th Dec 24
Republican vs Democrat Presidents and the Stock Market - 13th Dec 24
Stock Market Up 8 Out of First 9 months - 13th Dec 24
What Does a Strong Sept Mean for the Stock Market? - 13th Dec 24
Is Trump the Most Pro-Stock Market President Ever? - 13th Dec 24
Interest Rates, Unemployment and the SPX - 13th Dec 24
Fed Balance Sheet Continues To Decline - 13th Dec 24
Trump Stocks and Crypto Mania 2025 Incoming as Bitcoin Breaks Above $100k - 8th Dec 24
Gold Price Multiple Confirmations - Are You Ready? - 8th Dec 24
Gold Price Monster Upleg Lives - 8th Dec 24
Stock & Crypto Markets Going into December 2024 - 2nd Dec 24
US Presidential Election Year Stock Market Seasonal Trend - 29th Nov 24
Who controls the past controls the future: who controls the present controls the past - 29th Nov 24
Gold After Trump Wins - 29th Nov 24
The AI Stocks, Housing, Inflation and Bitcoin Crypto Mega-trends - 27th Nov 24
Gold Price Ahead of the Thanksgiving Weekend - 27th Nov 24
Bitcoin Gravy Train Trend Forecast to June 2025 - 24th Nov 24
Stocks, Bitcoin and Crypto Markets Breaking Bad on Donald Trump Pump - 21st Nov 24
Gold Price To Re-Test $2,700 - 21st Nov 24
Stock Market Sentiment Speaks: This Is My Strong Warning To You - 21st Nov 24
Financial Crisis 2025 - This is Going to Shock People! - 21st Nov 24
Dubai Deluge - AI Tech Stocks Earnings Correction Opportunities - 18th Nov 24
Why President Trump Has NO Real Power - Deep State Military Industrial Complex - 8th Nov 24
Social Grant Increases and Serge Belamant Amid South Africa's New Political Landscape - 8th Nov 24
Is Forex Worth It? - 8th Nov 24
Nvidia Numero Uno in Count Down to President Donald Pump Election Victory - 5th Nov 24
Trump or Harris - Who Wins US Presidential Election 2024 Forecast Prediction - 5th Nov 24
Stock Market Brief in Count Down to US Election Result 2024 - 3rd Nov 24
Gold Stocks’ Winter Rally 2024 - 3rd Nov 24
Why Countdown to U.S. Recession is Underway - 3rd Nov 24
Stock Market Trend Forecast to Jan 2025 - 2nd Nov 24
President Donald PUMP Forecast to Win US Presidential Election 2024 - 1st Nov 24

Market Oracle FREE Newsletter

How to Protect your Wealth by Investing in AI Tech Stocks

Has Gold Really Been So Frantic?

Commodities / Gold and Silver 2011 Sep 03, 2011 - 03:26 PM GMT

By: Ben_Traynor

Commodities

Best Financial Markets Analysis ArticleThere's been a lot of talk about how volatile gold's been this summer. The numbers tell a different story...

GOING BY some of the recent headlines, you'd think gold prices had just gone through the most hectic and almighty summer.


Yet volatility is running nowhere near the levels it hit when Lehmans collapsed in late 2008. 

Back then you had daily price swings– taken as the difference between the afternoon London Fix price one day to the next – coming in above 4%...above 5%...and, on two occasions (18 Sep. and 24 Nov.) even over 6%. In a single day.

The biggest one-day move of summer 2011 – the 5.6% between August 23 and 24 – was, granted, a biggy. Also of note was the 3.4% move two days later as the price recovered.

But these were exceptions. You have to go back to the first week of October 2009 for another move larger than 3%. And, of course, these are one day moves. Some days are exceptional – they do not, of themselves, confirm a trend.

To see the picture more clearly, take a look at daily volatility smoothed out as a rolling one-month average:
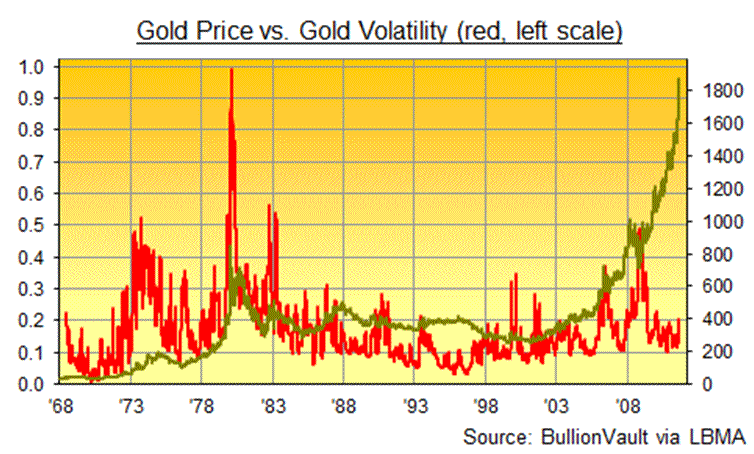
Barely a ripple compared to post-Lehmans – and positively comatose next to the frantic days of gold's last bull market in the 1970s.

What about the year-on-year change in gold prices? Gold has gained nearly 50% since this time last year – a belter of a return in anyone's book. But does this automatically make gold a volatile bubble?

Gold's Z-score – a measure of how big a given move is compared to historical averages – suggests not. Going back to 1968 – the year the London gold market began setting its prices in Dollars – daily gold prices in that currency have, on average, been just under 12% above where they were one year previously (there have obviously been some downwards move, but the net effect is a positive upwards trend). 

The standard deviation of these percentage gains – a measure of how much 'spread' there is around the mean average – comes out at around 29. So a 50% move is not insubstantial. But neither is it as big a deal as you might think.

Crunching the numbers, gold's current Z-score (that 50% move, minus the average, all divided by the standard deviation), comes in around 1.3 – way below what it hit at gold's last peak:
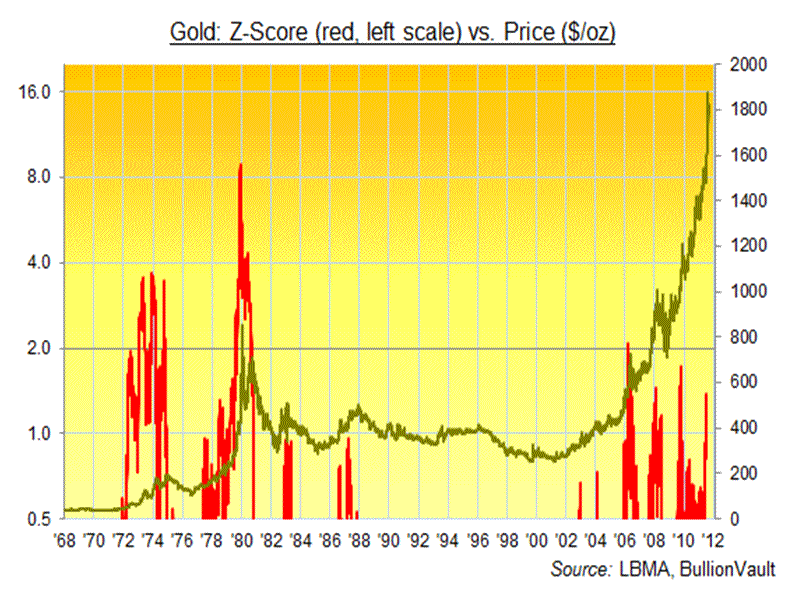
Lessons from recent asset bubbles suggest the Z-score will need to hit at least 2.0 to qualify for that category – and even that doesn't mean an imminent 'pop' (a fuller discussion of the Z-score -  including how it relates to this year's run up and subsequent fall in silver prices – can be found here).

None of this is to say we won't encounter choppier waters ahead. The months of September and October have historically thrown up some nasty financial surprises – witness the Panic of October 1907, the Wall Street Crash in October 1929, Black Monday in, erm, October 1987, or indeed the Lehmans collapse of September 2008.

But the current news flow suggests there's a substantial chance any fresh calamity will serve to further erode investor confidence – and see gold prices head higher as even more people look for a safe haven. 

A portfolio allocation of zero percent to gold would – in the current environment – suggest an investor who is intensely relaxed about the clear and present risks out there. 

By Ben Traynor
BullionVault.com

Gold price chart, no delay   |   Buy gold online at live prices

Editor of Gold News, the analysis and investment research site from world-leading gold ownership service BullionVault, Ben Traynor was formerly editor of the Fleet Street Letter, the UK's longest-running investment letter. A Cambridge economics graduate, he is a professional writer and editor with a specialist interest in monetary economics.

(c) BullionVault 2011

Please Note: This article is to inform your thinking, not lead it. Only you can decide the best place for your money, and any decision you make will put your money at risk. Information or data included here may have already been overtaken by events – and must be verified elsewhere – should you choose to act on it.


© 2005-2022 http://www.MarketOracle.co.uk - The Market Oracle is a FREE Daily Financial Markets Analysis & Forecasting online publication.


Comments

Paul_B
03 Sep 11, 17:51
Gold over the next few months

Looking at these graphs as provided, one might be forgiven for concluding that gold has now gone parabolic and we're staring the end-game in the face. The truth, however, is very different. The graphs cover a very long time period and make no allowance whatsoever for inflation - not even the remarkably conservative inflation figures cooked up by official sources. Hence the appearance of the development of a parabola is entirely illusory.

Given the current macroeconomic circumstances, which are basically the same as they have been for the last couple of years, with continuing low real interest rates, the future for PMs over the autumn months has rarely looked more promising. This bull has plenty of legs left in it yet. I'd be very surprised if we don't see $2,200 by the year end.


Post Comment

Only logged in users are allowed to post comments. Register/ Log in