After the Stock Market Peak
Stock-Markets / Stock Markets 2011 Aug 29, 2011 - 06:17 AM GMTBy: Donald_W_Dony
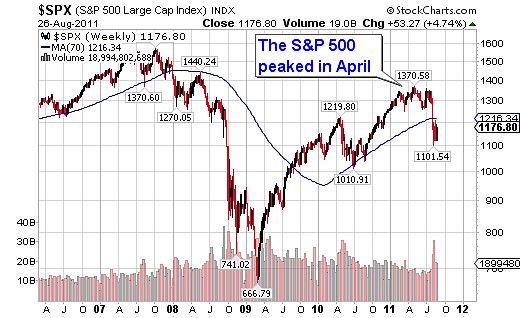
 The S&P 500, along with all global stock indexes, has started another bear market decline. The peak developed in April, after over two years of advancing (Chart 1).

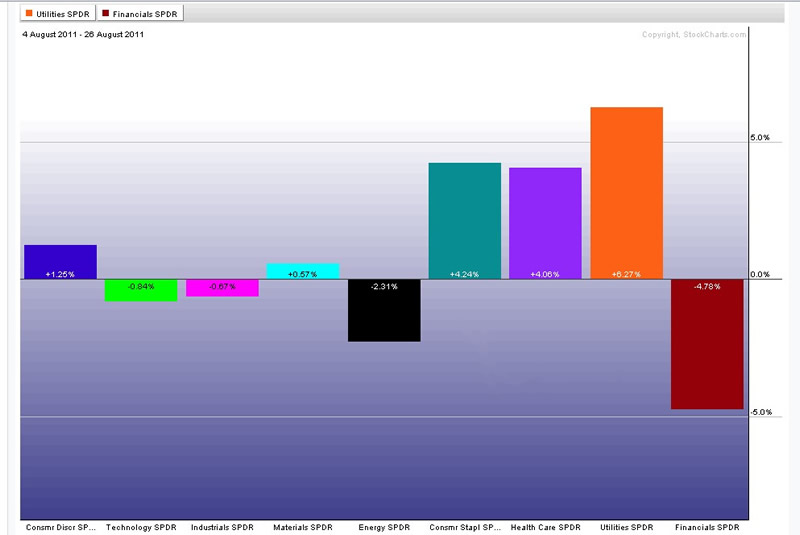
The rotation of industry sectors was typical of a market top. Financials, which normally leads the market, fell in July and has been the worst performing group compared to the S&P 500. Defensive sectors, such as heath care, consumer staples and utilities, have become the best performers since the bear market started in early August (Chart 2).

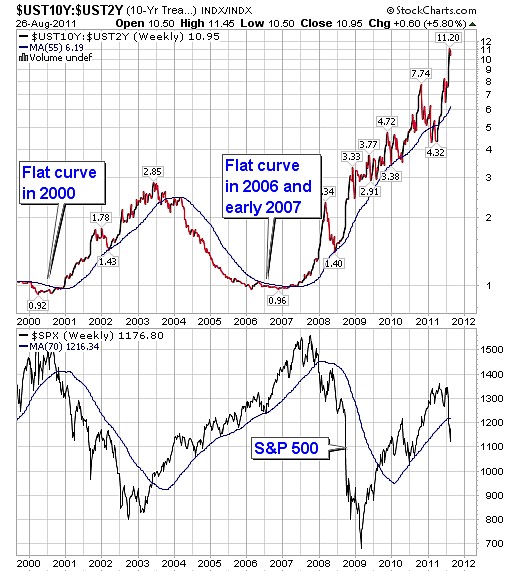
The standard movement in bonds during a stock market crest is for the yield curve to be flat. Normally, after several years of economic expansion, short and long term yields are roughly equal. However, in this equity peak, the US yield curve has remained very steep (Chart 3) suggesting that this stock pullback is more of a correction within a longer term bull market, something similar to mid-2006.

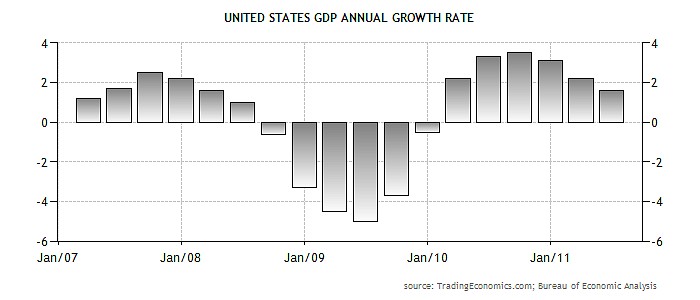
The pattern of US economic growth also does not match the usual stock market peak. Usually, the equities start to descend three to eight months before GDP begins to slowdown. Economic expansion crested in mid-2010 (Chart 4).

Bottom line: Sector rotation is following the standard pattern for a market top. Financials are usually the first group to decline followed by higher performance in defensive sectors.
The steepening yield curve in the bond market and the nine months of falling GDP suggests the stock market decline is likely nearing the end verses just beginning to decline.
Investment approach: Bear markets can vary from four to forty months but the average is 31 months. The evidence from the bond market and the business cycle suggests that this pullback will likely be shorter than the average.
One of the first signals of the bottom in the bear market, will come from the leading industry groups. Financials and consumer discretionaries will outperform the defensive sectors indicating growth is more important then safety.
By Donald W. Dony, FCSI, MFTA
www.technicalspeculator.com
COPYRIGHT © 2011 Donald W. Dony
Donald W. Dony, FCSI, MFTA has been in the investment profession for over 20 years, first as a stock broker in the mid 1980's and then as the principal of D. W. Dony and Associates Inc., a financial consulting firm to present. He is the editor and publisher of the Technical Speculator, a monthly international investment newsletter, which specializes in major world equity markets, currencies, bonds and interest rates as well as the precious metals markets.
Donald is also an instructor for the Canadian Securities Institute (CSI). He is often called upon to design technical analysis training programs and to provide teaching to industry professionals on technical analysis at many of Canada's leading brokerage firms. He is a respected specialist in the area of intermarket and cycle analysis and a frequent speaker at investment conferences.
Mr. Dony is a member of the Canadian Society of Technical Analysts (CSTA) and the International Federation of Technical Analysts (IFTA).
Donald W. Dony Archive |
© 2005-2022 http://www.MarketOracle.co.uk - The Market Oracle is a FREE Daily Financial Markets Analysis & Forecasting online publication.


